This Pandemic Mapping Project Shows How Covid-19 Transformed Our Worlds
Toward the end of 2020, I interviewed an archaeologist who—while locked out of her lab due to university health restrictions—was collecting photographs of Covid-19’s stamp on public spaces. Latex gloves and polypropylene masks, carelessly discarded in streets, parks, and gutters, featured prominently. She related a horrifying belief: Eventually, these non-decomposable medical accessories would form their own geological layer, a permanent mark of the annus horribilis 2020 in our earthly strata.
Whether or not that particular impact is ever revealed, others will be, because archivists, librarians, photographers, and scientists preserved all manner of pandemic-era media. While the coronavirus infected millions, shut down the global economy, and set the table for social and political foment, they saved masks, gloves, and social distancing floor stickers; screenshots from Zoom and online virus trackers; photographs of food bank lines, restaurant parklets, and mobile morgues; videos of ritualized pot-banging for health workers; anti-vax conspiracy paraphernalia; and so much more.
Such images and ephemera form a kind of “history from below,” to borrow a phrase from The Ghost Map, Steven Johnson’s book about the birth of epidemiology in 1850s London. “Most world historic events—great military battles, political revolutions—are self-consciously historic to the participants living through them,” he writes. Pandemics are world-changing, too, “but the participants are almost inevitably ordinary folks, following their established routines, not thinking for a second about how their actions will be recorded for posterity.” Johnson is pausing to marvel at the fact that modern readers can still discover, in minute detail, the daily habits of long-dead Londoners who lived near what turned out to be an infected pump because they were interviewed by John Snow, the physician who helped crack the origins of cholera by mapping their cases.
Social media and the 24-hour news cycle probably place us in a more self-conscious era than those who lived through the infectious diseases of yore. But it’s still true that the sea changes of the Covid era were lived by regular people. If you or a loved one tested positive for the virus, the symptoms, course, and probable origin of the infection—jotted down by a doctor or entered into a health department database—became part of the public health record, available to be studied by science for decades to come. Even if you didn’t, your days of sheltering inside, wearing a mask, waiting on taped-up sidewalks, and sacrificing the social time that might have made it all go down easier but was precisely the thing that could kill you: All of that, too, was part of the global socio-political inflection point known as Covid-19, and you were as much a player as anyone. Historians have the archives to prove it.
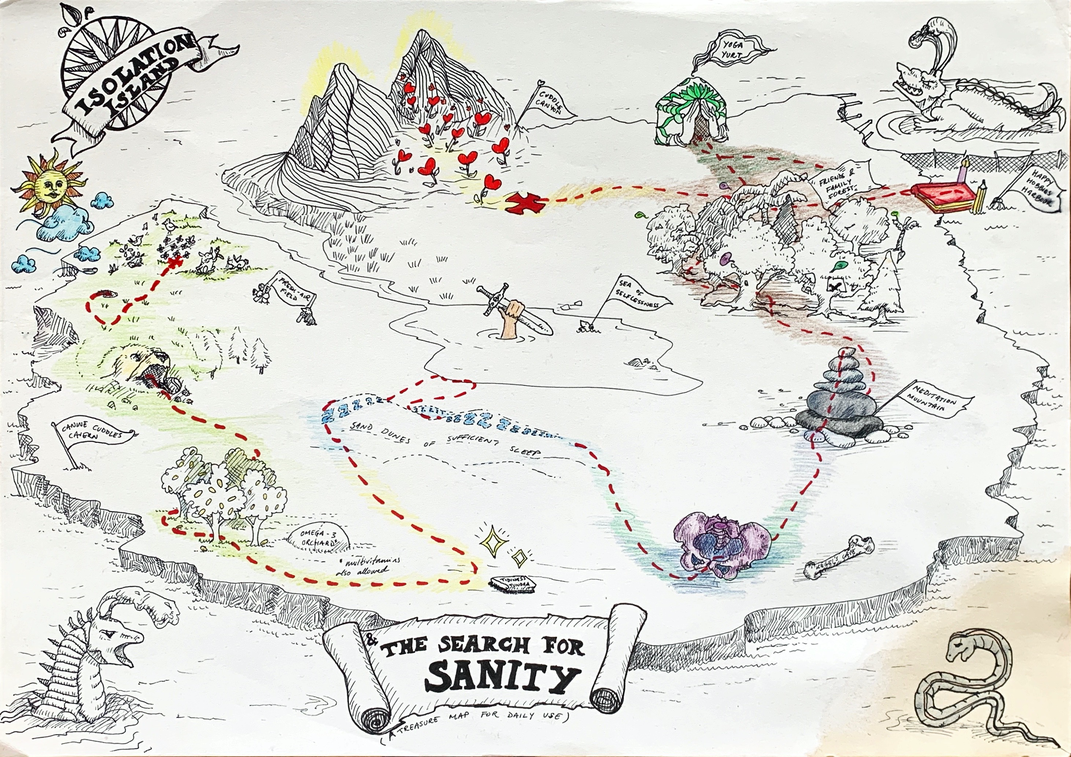
But what pictures, data, and even fossilized personal protective equipment can’t capture is what it felt like to live through a horizonless public health disaster. We have harrowing mental health statistics whose implications have yet to be fully reckoned with, such as the tripled rate of depression among U.S. adults, or the one in four young U.S. adults who have contemplated suicide. But what about the specific sadness of a teacher using Zoom in front of an empty classroom, or the fear of a recent graduate navigating the virus on his commute to a grocery store? What about the exhaustion of a parent balancing her work-from-home routine with the demands of two young children, or the pleasure of birdsong suddenly audible against the absence of neighborhood traffic? Such heartfelt ephemera is harder to quantify.
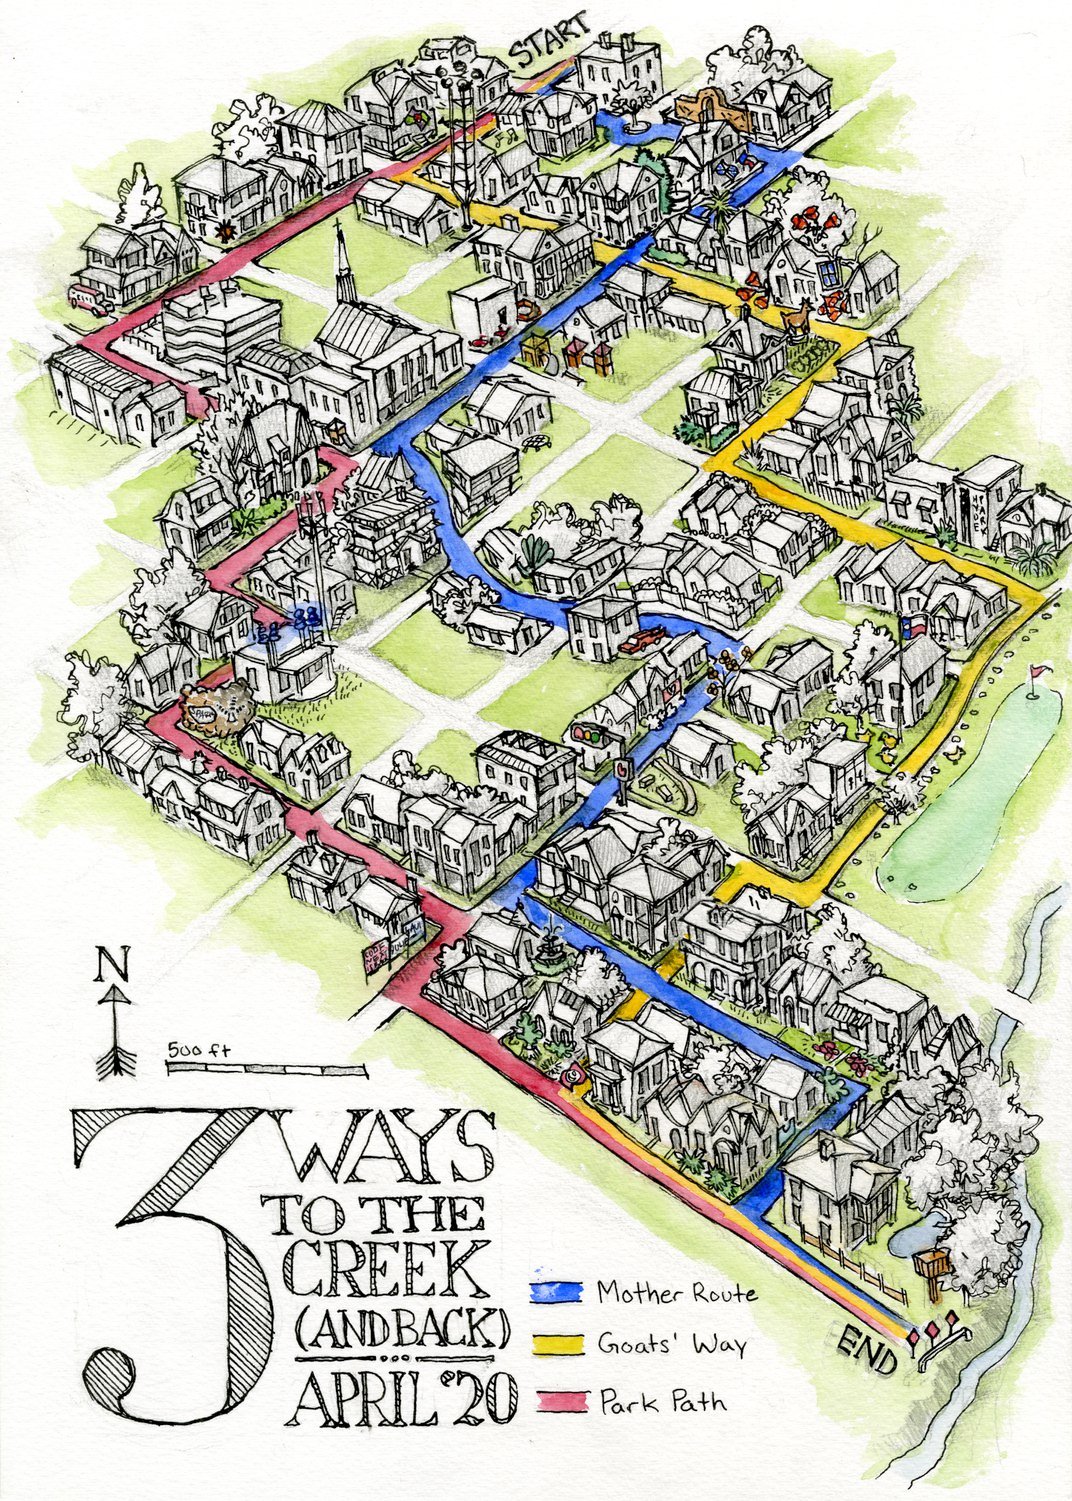
A few weeks after the World Health Organization declared Covid-19 a pandemic in March 2020, an estimated three billion people around the world were told by their governments to stay at home. As social, economic, and political orders turned inside out, my colleague and CityLab’s audience engagement editor Jessica Lee Martin and I had the idea to ask readers to document how the pandemic was reshaping their homes, communities, and everyday spaces in real-time. We published a call-out to readers asking them to create homemade maps and reflect on their new lockdown lives. In MapLab, an email newsletter I write about how cartography intersects with the news, I shared an example: a square-mile-ish grid of my neighborhood in San Francisco, shown with the nearby hospital emanating anxious flash marks from a rooftop siren added for emphasis.
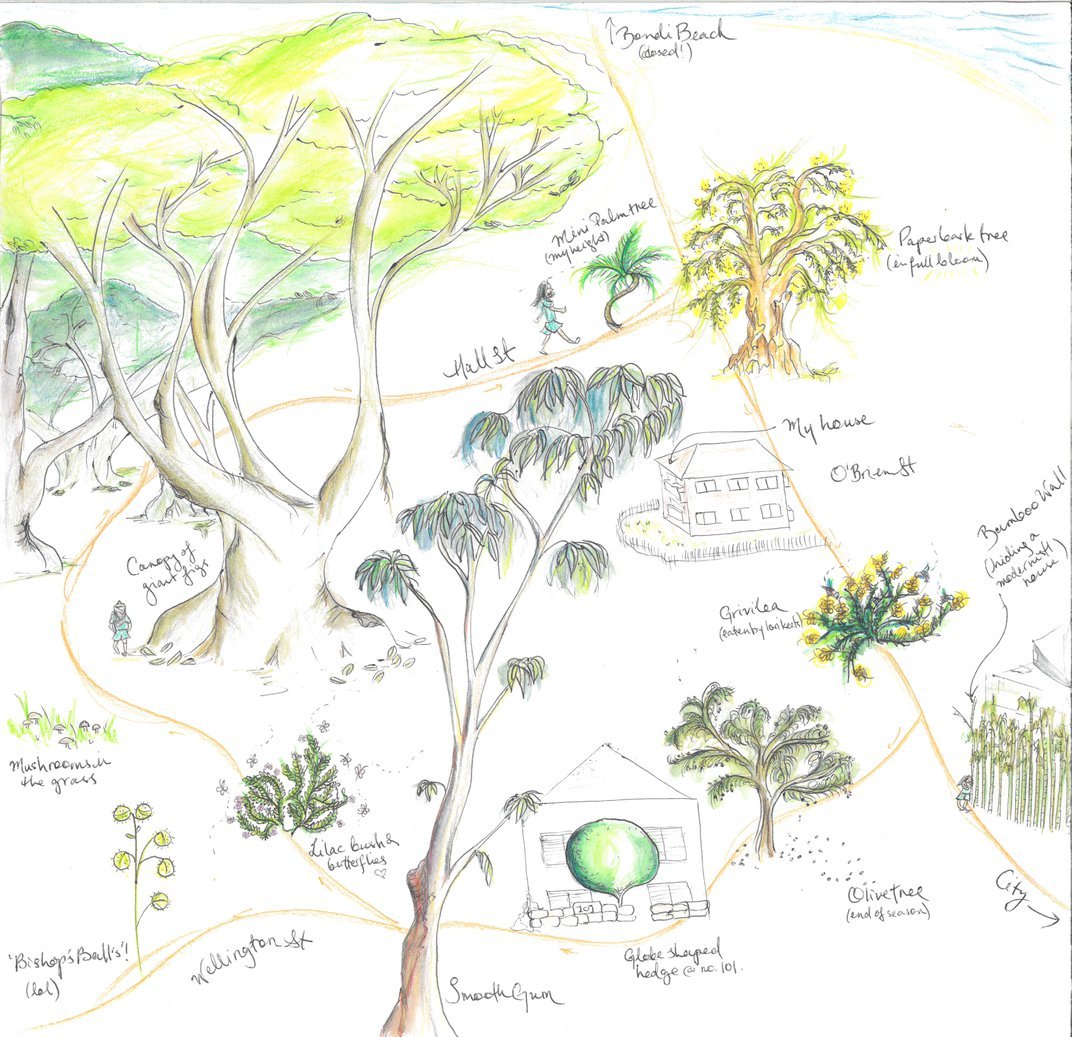
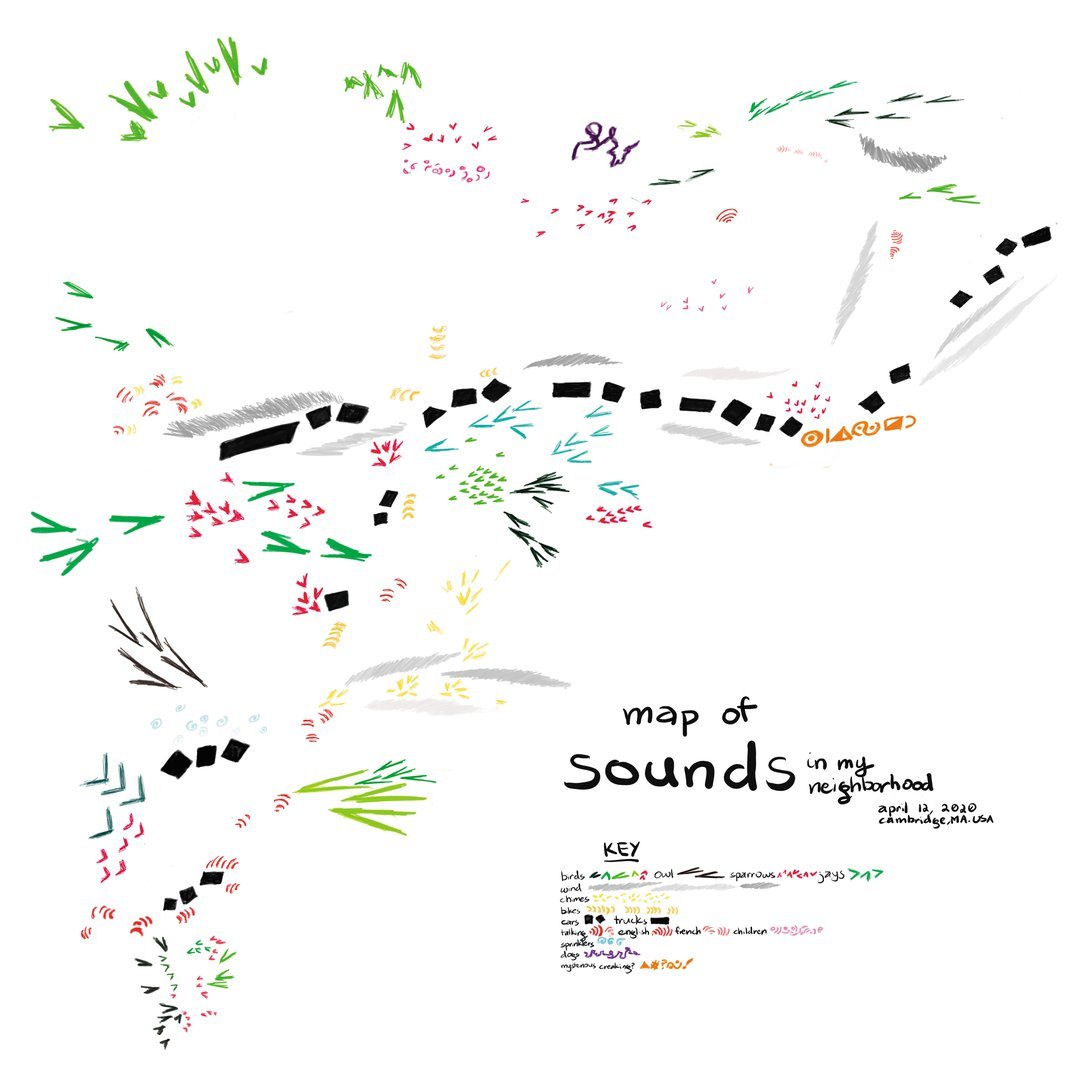
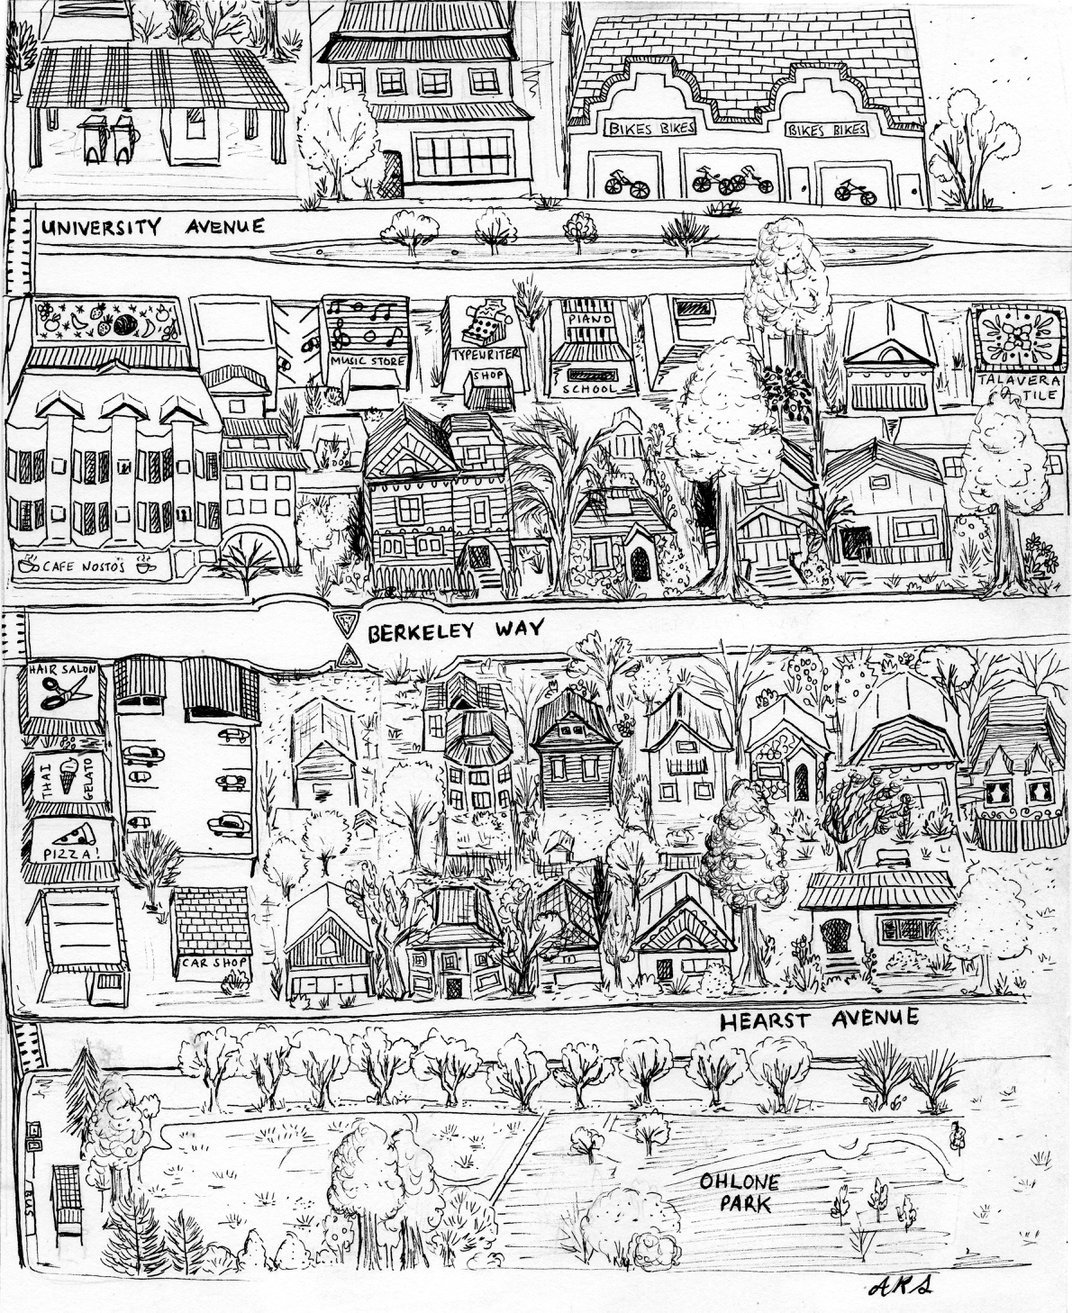
The response overwhelmed us. With pens, paper, digital tools, tiles, clay, and whatever else was around, nearly five hundred people on six continents sent in breathtaking maps and stories. Worry and fear showed up often in these images, but so did inspiring quantities of resilience, hope, and creative spirit. Readers mapped the tight quarters of apartments in Bogor, Buenos Aires, and Istanbul. They mapped the one-kilometer neighborhood areas where they were allowed to range in southern Europe. They mapped the evaporation of work–life boundaries in homes across Canada, Pakistan, and South Africa, as millions found themselves teleworking, parenting, and grasping for sanity from kitchens and couches. Others mapped the challenges and traumas faced by nurses, bus drivers, and other essential workers thrown directly into the path of a fatal disease.
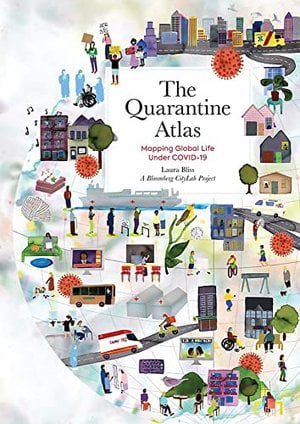
My new book, The Quarantine Atlas, documents a piece of the emotional turbulence of the world turning upside down. It presents 65 maps made by people living all over the world during the peaks and valleys of the pandemic, paired with stories they shared. It also includes eight original essays (six of them accompanied with cartography-inspired illustrations by Jennifer Maravillas) that illuminate our changed relationships to our homes, neighborhoods, natural environments, work settings, and other places physical and psychological. All together, the pages are a multi-paned window into how the virus transformed our outer and inner landscapes. Born of the twilight hours the world spent at once together and apart, the sum of its parts makes a collective work of art.
The Quarantine Atlas: Mapping Global Life Under COVID-19
The Quarantine Atlas is a poignant and deeply human collection of more than 65 homemade maps created by people around the globe that reveal how the coronavirus pandemic has transformed our physical and emotional worlds, in ways both universal and unique. Along with eight original essays, it is a vivid celebration of wayfinding through a crisis that irrevocably altered the way we experience our environment.
The uncertainty, the tragedy, the stomach-churning inversion of domestic life: There was no precedent for this stuff, no Google Maps or Yelp to tell anyone how to navigate it. The pandemic tossed out plans for new jobs, visits, weddings, trips. It dried up prospects for work and romance. It taught us the phrase “flatten the curve” but tricked us when a flat curve still meant hundreds of thousands of people sick. As days, weeks, and months melted into slurry, simple narratives of progress, beginnings, and endings no longer held. “What is time?” went the semi-joking quarantine refrain.
Covid also exposed and exploited existing social inequalities so profoundly that the idea of “returning to normal” quickly became unfathomable. In the U.S., the size of our houses, the health of our finances, and the color of our skin were key preconditions determining life and death. When George Floyd was choked to death under the knee of a Minneapolis police officer in May 2020, it made the lethality of racism all the more undeniable. In honor of Floyd and Breonna Taylor, the 26-year-old woman—an essential worker—who was killed two months earlier by police in her Louisville apartment, millions poured into the streets around the world to protest anti-Black killings and systemic racism, despite health concerns.
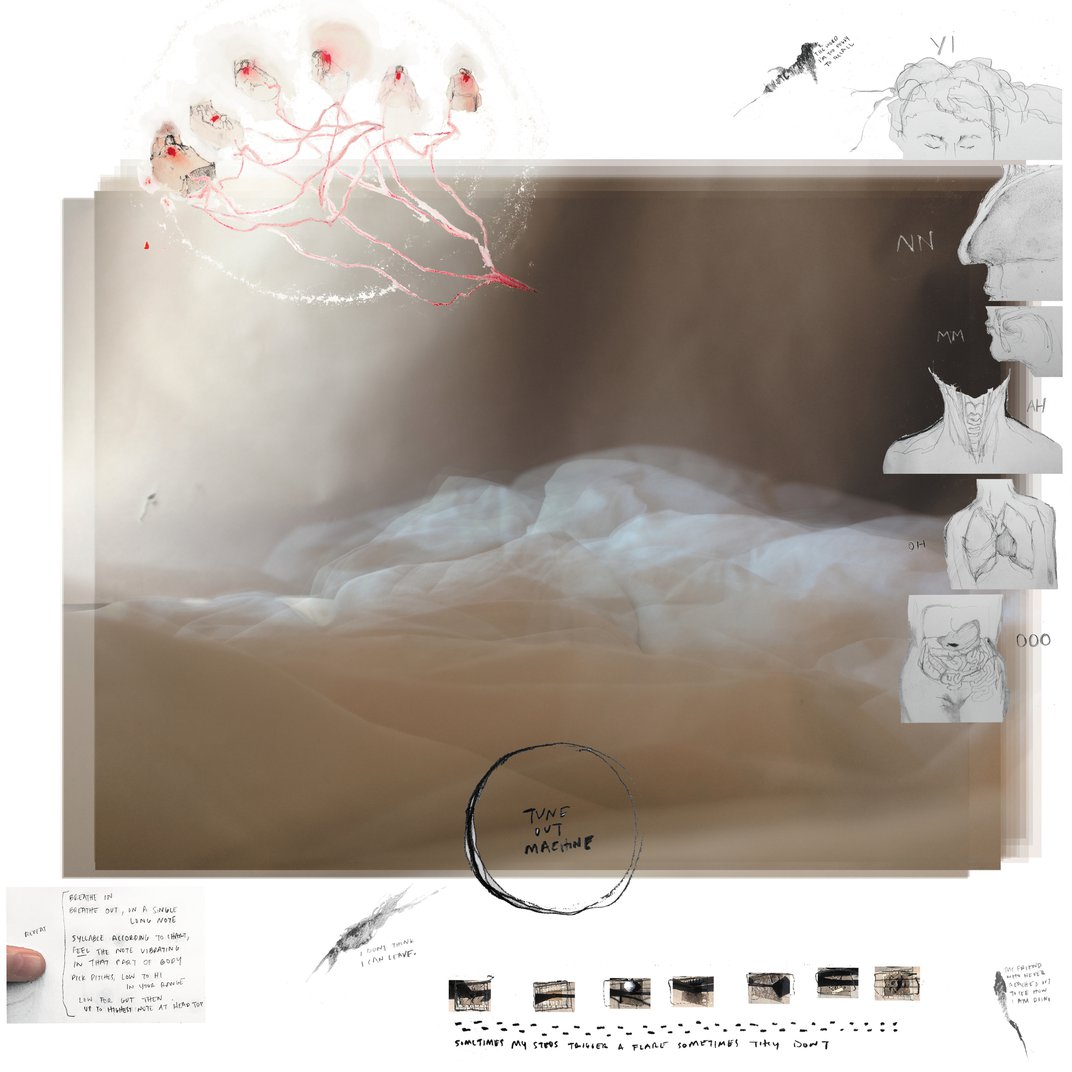
Amid shock and upheaval, our pandemic mapping project struck a chord. By pinning down their upended lives to paper, readers could take stock of new, unthinkable circumstances and make them real and knowable to themselves and to others. They could plot observations of an unstable present and grasp relationships as they existed in the moment. Their maps capture specific feelings and ideas playing out in the tumultuous now, rather than concerning themselves too much with what might come next.
The maps also surface how many of Covid’s changes relate to location, distance, and geography. In some ways perspectives turned local; in other ways they widened to see the permeability of borders and bodies in the face of pathogens and aerosols. The boundaries between work, family, and leisure bled together inside the home, yet we also became hyper-aware when we left and re-entered, sanitizing, masking, and psychologically preparing for those transitions. We saw that where we live has much to do with how much risk we face, judging by the disproportionate infection rates in communities of color. Maps have a unique ability to construct meaning about place, and these maps show how individuals from diverse walks of life negotiated the world around them in new ways and with new eyes.
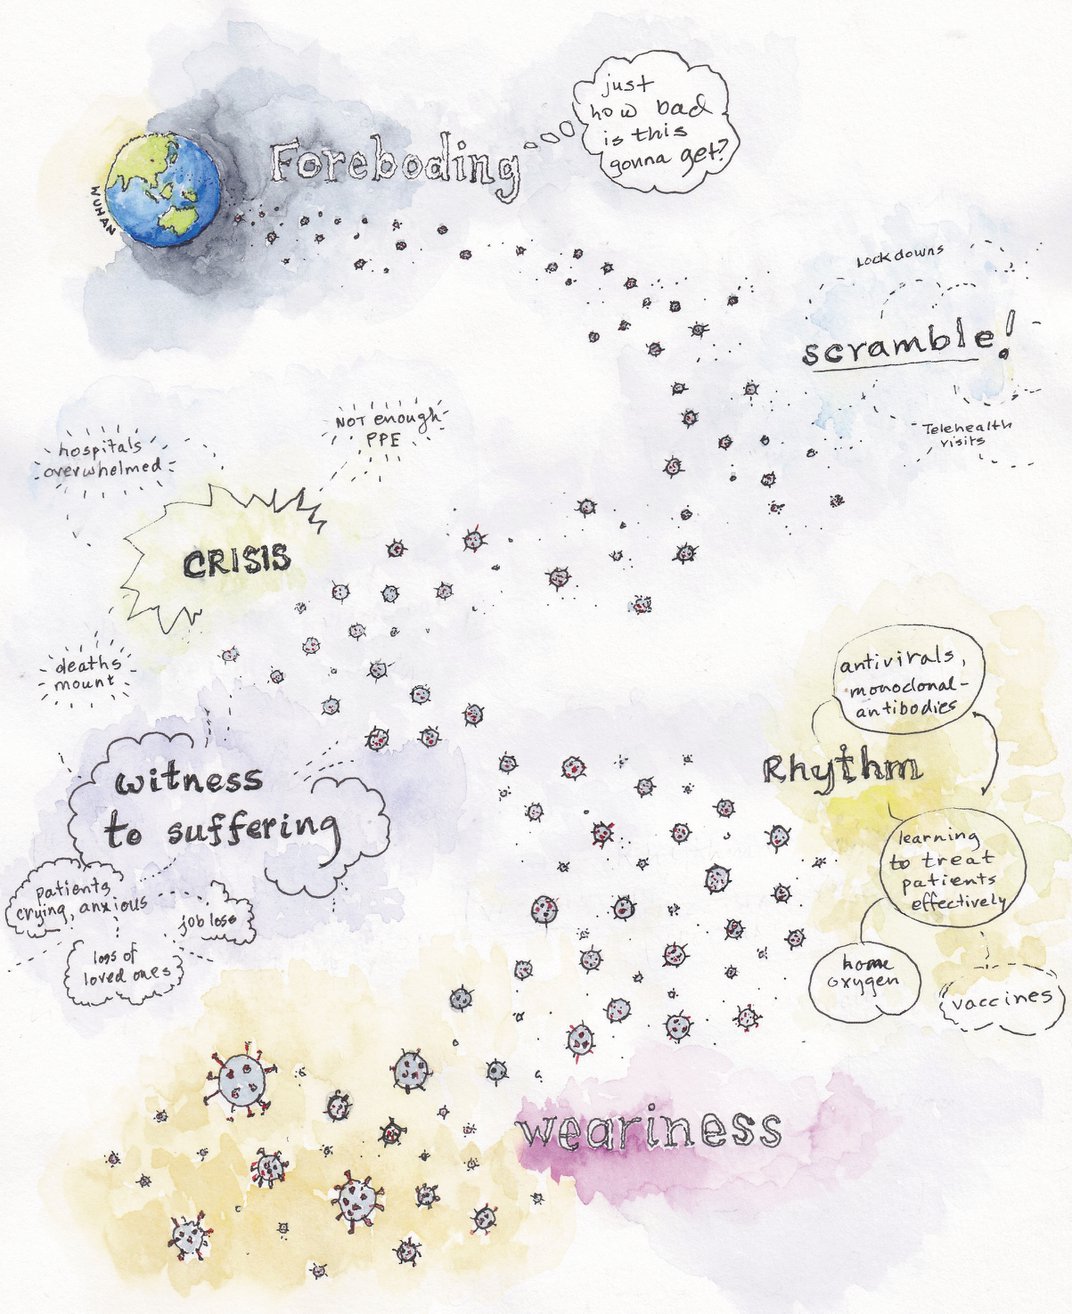
During the pandemic, these maps were tools for empathy and human connection. They helped readers transcend the bounds of lockdown in a way that words could not. In the months and years ahead, we might look back at them and remember how a landscape of crisis and pain also held pockets of possibility and growth. In their dazzling plurality, they also remind us that no single perspective, assumption, or belief should necessarily define how we see the people around us or the places we live, no matter how long we’ve held it.
This will be key as the world charts a post-pandemic future. Now is the time for a collective cartography, grounded in hope and solidarity, as we rebuild better systems and relationships with one another and our planet. Such efforts are underway, even if the forces of fear often overshadow them. I think of a chant that rose from Black Lives Matter protesters, a chant that is transformative in its pure insistence that a reality must be seen, must be made true: Whose streets? Our streets. That is the map to follow.
From the book The Quarantine Atlas by Laura Bliss, a Bloomberg CityLab Project. Reprinted by permission of Black Dog & Leventhal, an imprint of Running Press, a part of the Perseus division of Hachette Book Group. Copyright © 2022 by Bloomberg L.P.
Recommended Videos
This article has been archived for your research. The original version from Smithsonian can be found here.
