UK Government Report & Excess Deaths Data confirm COVID Vaccination takes 5 months to kill recipients
Data published by the UK Government reveals the vaccinated population in England has a higher mortality rate per 100,000 than the unvaccinated population.
The figures show that it takes approximately 5 months from receiving the Covid-19 vaccine for that elevated mortality rate to be realised.
This, therefore, implies the mass winter “Booster” vaccination campaign is to blame for the sudden rise in weekly excess deaths across England since the end of April 2022.
The Office for National Statistics (ONS) publishes weekly figures on deaths registered in England and Wales. The most recent data shows deaths up to 15th July 2022.
The following chart, created by the ONS, shows the number of deaths per week compared to the five-year average –
The most recent week shows that there were 10,515 deaths in England and Wales, equating to 1,113 excess deaths against the five-year average. But this is a trend that has been occurring since the end of April 2022.
The question is, why?
You’ve likely seen the headlines in recent months on Doctors being baffled by an uptick in “Sudden Adult Death Syndrome” (SADS)?
If you haven’t then we have covered it in detail in an article you can read here. But this “baffling” uptick in healthy young people dying unexpectedly from “a mysterious syndrome”, and the fact excess deaths are on the rise again in England and Wales is simply because of Covid-19 vaccination.
This is because further ONS data shows that Covid-19 vaccination significantly increases the risk of death and kills thousands after five months.
On the 6th July, the Office for National Statistics (ONS) published its latest dataset on deaths by vaccination status in England, and it has revealed a whole host of shocking findings.
For example, we now know that according to the ONS, 94% of all Covid-19 deaths in England were among the vaccinated population in April and May 2022. With 90% of those deaths among the triple/quadruple vaccinated.
We also now know that Covid-19 vaccination increases children’s risk of death between 4,423% and 13,633%.
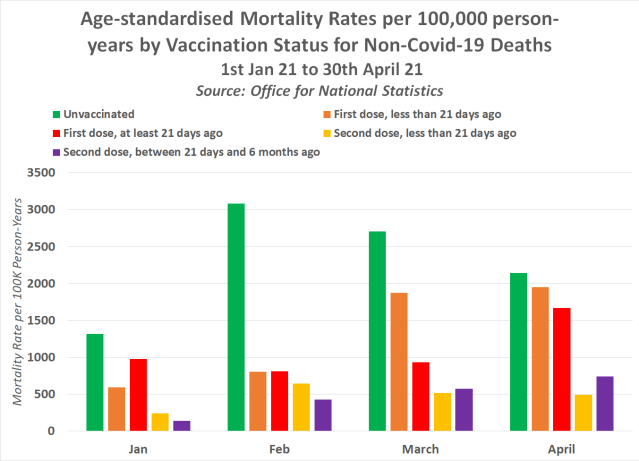
Table 2 of the ONS dataset contains figures on the monthly age-standardised mortality rates by vaccination status for deaths between 1st Jan 21 and 31st May 22. The first Covid-19 injection was administered in England on 8th December 2020, and here are the figures on mortality rates by vaccination status in the following 4 months –
The unvaccinated were substantially more likely to die of any cause other than Covid-19 than the vaccinated population in both January and February 2021, before the rates seemed to normalise by the end of April.
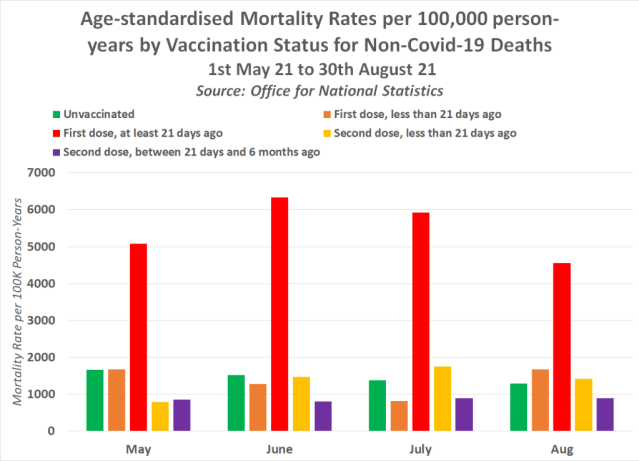
But look at what happened from May 2021 onwards –
All of a sudden, the vaccinated population as a whole were more likely to die than the unvaccinated of any cause other than Covid-19, and this trend has continued month after month since. It also turns out this trend tally’s up with those who received the Covid-19 injections first.
People in England were vaccinated by order of age, with the eldest being offered the Covid-19 injection first.
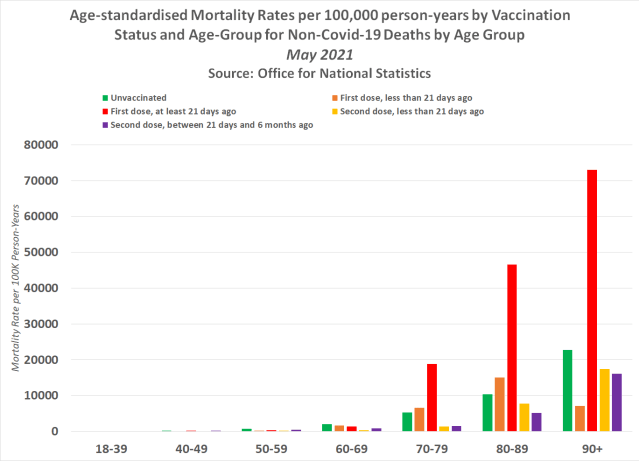
The following chart shows the age-standardised mortality rates per 100,000 person-years by vaccination status and age-group for the month of May 2021 –
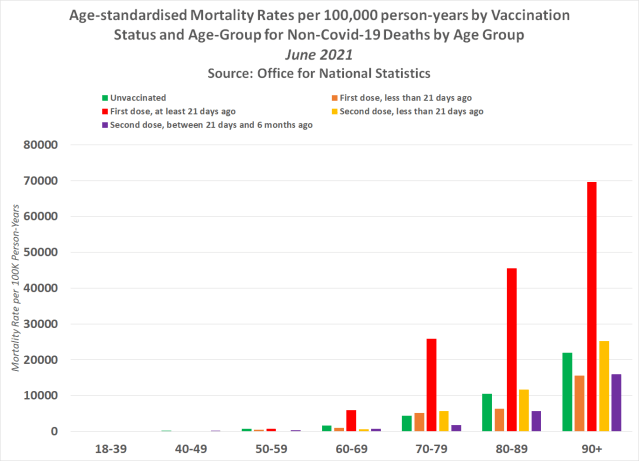
The figures show that in May the three age groups who had a higher mortality rate among the vaccinated were the 70-79, 80-89, and 90+-year-olds. The trend then continues into June with vaccinated 60-69-year-olds joining the highest mortality rate club.
The ONS data shows that this trend continues month after month until all age groups are more likely to die if they have been vaccinated. So with the UK Government starting a nationwide winter booster campaign in December 2021, it should actually come as no surprise as to why five months later we started to see excess deaths on the rise again in England and Wales –
A trend that is, unfortunately, showing no signs of slowing down.


