Understanding hesitancy with revealed preferences across COVID-19 vaccine types | Scientific Reports
The empirical analysis is based on a nationally representative survey (N = 1000) that we conducted in Hungary at the end of the third wave of the pandemic when vaccines were already available for everyone (Number of cases can vary among analyses. For a precise consideration of sample sizes, please see “Methods”). Data collection is described in “Methods”.
Vaccine assignment and revealed preferences
In our survey, we focused on demographic, socio-economic, and health related questions that could help to understand COVID-19 vaccine hesitancy better. Specifically, the participants had to evaluate each vaccine, identify their trusted sources regarding the vaccination and state whether their assessment has changed over the third wave period. Then, they were asked a list of questions about their COVID-19 infection and their vaccination history including the date of potential positive tests, date and type of the received and the rejected vaccines. This latter information provides new insights into the nature of vaccine hesitancy through the analysis of revealed vaccine preferences. From now on, (evaluate) refers to whether an individual considers the vaccine types acceptable, (reject) refers to the act of not willing to take the assigned vaccine and (accept) refers to the act of taking the assigned vaccine.
Table 1 describes the vaccination related variables by socio-demographic characteristics of the respondents. The evaluation and the rejection of vaccines—which information makes our dataset unique—are presented by sex, education level, chronic illness, and age categories. Here we can distinguish those who rate all vaccine types unacceptable ((2.3%)) from those who evaluate at least one vaccine unacceptable but evaluate another acceptable ((18.2%)). Furthermore, we can compare those who accepted the first vaccine offered ((62.9%)) with those who rejected the first offer ((10.8%)). Apparently, the women, the younger cohorts, the lower educated and those with no chronic disease are more likely to reject a vaccine offer in general. We also find that (5%) of those respondents who received Pfizer rejected at least one other vaccine. These shares are lower for other vaccine types. Furthermore, we find that (20.3%) of all respondents have accepted Pfizer without rejecting any vaccines while (5.8%) waited for Pfizer after rejecting another vaccine.
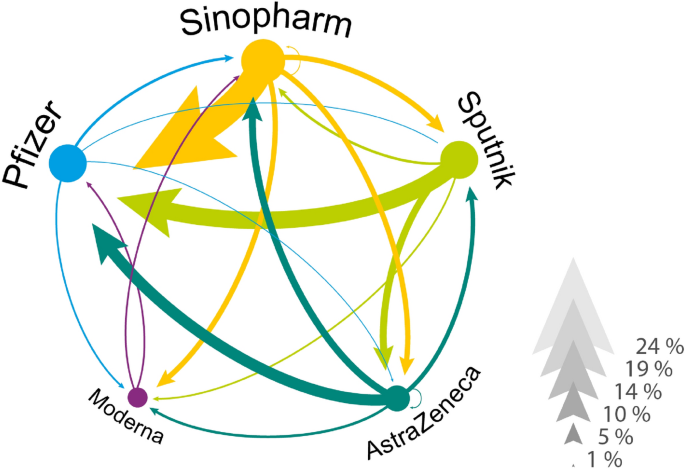
Revealed vaccine preferences by rejection and re-selection. The network of revealed vaccine preferences in Hungary. Vaccines are linked if someone in our data has rejected one vaccine and later accepted another. The direction of the link goes from rejected to accepted and the width of the arrow corresponds to the percentage of individuals who acted accordingly. We conditioned on those individuals who rejected at least one vaccine.
Figure 1 illustrates the network of revealed preferences across vaccine types from our data. Focusing on those who rejected a vaccine (in total, 18% of our vaccinated respondents rejected an assigned vaccine and later took another type), we observe a high ratio of individuals, who received Pfizer but rejected Sinopharm ((23%)), Sputnik ((15%)) or AstraZeneca ((9.7%)). We also see that a few individuals rejected an mRNA vaccine to accept a less popular vaccine later. For example, (2.2%) of the hesitant population rejected Pfizer to receive Sinopharm.
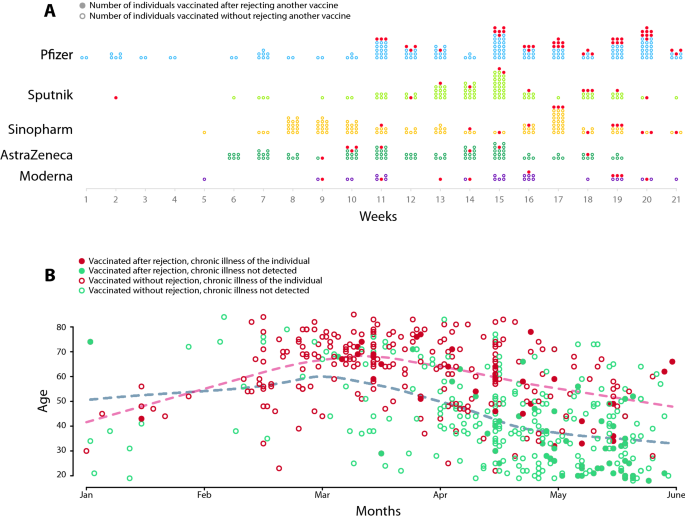
Dynamics of vaccination by vaccine types and re-selection. (A) Dynamics of vaccination by vaccine types. Dots represent the taken vaccine by weeks in 2021. Dark dots represent the vaccines that were accepted after rejecting another one. (B) The dynamics of vaccination by age and chronic illness. We used red circles for the chronically ill patients and green circles for the healthy individuals to show the day of receiving the first vaccine. Filled markers denote the individuals who rejected at least one vaccine earlier. Dashed lines represent the local averages of vaccinated patients’ age.
Figure 2A demonstrates the dynamics of revealed preferences by vaccine types. The Pfizer was the first vaccine that patients could receive in Hungary starting at the first week of 2021. The Sputnik, the Sinopharm and the AstraZeneca only became available in larger quantities after week 5 of 2021. Most of the Moderna vaccines were accepted after week 9 of 2021. Figure 2B shows the time of the first vaccine and the age of the patients. We grouped the individuals based on chronic illness status and whether they rejected a vaccine in the past. We find that those chronically ill, elder patients who rejected vaccines received a more preferred vaccine in March. The younger healthy individuals who rejected a vaccine received a more preferred vaccine only after mid April. Supporting Information 1 contains further description of the dynamics of vaccination and rejection by age, chronic illness and vaccine types.
Trusted information sources characterize groups of vaccine preferences
To observe hesitancy by vaccine types, we asked respondents to evaluate vaccine types on a scale from 1 “unacceptable” to 5 “best”. For the reasons of simplicity, here we code all evaluations different from 1 as “acceptable” and analyse rating details in section “Individual selection improves vaccine assessment”. Supporting Information 2 illustrates that Pfizer and Moderna were more likely to get accepted than Sputnik, which is significantly more likely to get accepted than AstraZeneca and Sinopharm. Chi square tests imply that the distributions of vaccine acceptance are not independent from each other. Instead, acceptance is correlated across vaccine types, and especially between Pfizer and Moderna and between Sputnik and Sinopharm.
We use multivariate regression analysis to investigate the heterogeneity of vaccine evaluation by types and its association with the source of trusted information. This latter determinant was used in the previous studies to explain vaccine hesitancy25, while other research focused on the communication channels that individuals collected vaccine-related information from18,34. Accordingly, respondents were asked in our survey to confirm if they follow the vaccine-related advice of doctors, scientists, anti-vaccine propagators, politicians, family, friends, journalists and celebrities. These major actors communicated differently about the vaccines (Doctors and scientists argued for vaccination, see for example the recommendations of Hungarian Academy of Sciences: https://mta.hu/english/recommendation-of-the-hungarian-academy-of-science-on-the-management-of-the-covid-19-epidemic-in-the-short-and-long-term-110630. Anti-vaccine propagators emphasized the non-effectiveness and the side effects of the COVID-19 vaccines. A summary on anti-vax movement in Hungary can be found at https://www.iribeaconproject.org/our-work-analysis-and-insights/2021-09-16/hungarys-anti-vax-movement-alive-and-kicking. Some medical doctors warned against vaccines that are not approved by the EU, while others urged to vaccinate with any vaccine: https://www.reuters.com/article/us-health-coronavirus-hungary-vaccines-idUSKBN2CE2C3. The government communication campaigned for the non-EU-approved vaccines to improve their rate of acceptance by the population: https://www.euronews.com/2021/02/28/hungary-s-pm-viktor-orban-vaccinated-against-covid-with-chinese-sinopharm-vaccine. Yet, a heated debate around vaccine types has fragmented the society: https://hungarytoday.hu/hungarian-vaccination-politics-vaccine-preference-coronavirus-survey-willingness/). The respondents also had to name their most frequently used information channels on pandemic measures such as web news, social media, press, radio, TV, family and friends. These explanatory variables are complemented by demographic and socio-economic characteristics of respondents25. We apply a two-step procedure in the regression analysis. First, we use a machine learning technique to select the most important variables. Second, we run the regressions using the selected variables.
In the first step, we apply a variable selection method. This is important because the source of trusted information and the channel of communication can influence hesitancy simultaneously. The LASSO model, which is a short notation for the least absolute shrinkage and selection operator, enables us to select the most important variables that have high-enough predictive power. We describe the process in the “Methods” section in greater details. The estimation results are reported in Supporting Information 3, Table S2. We find that communication channels are not important determinants of hesitancy as all but one (web news) are dropped from the model. However, we see that both the demographic characteristics and the sources of trusted information on COVID-19 vaccination are important predictors of the outcome variables. We rely on this result when we select the explanatory variables in the linear probability models.
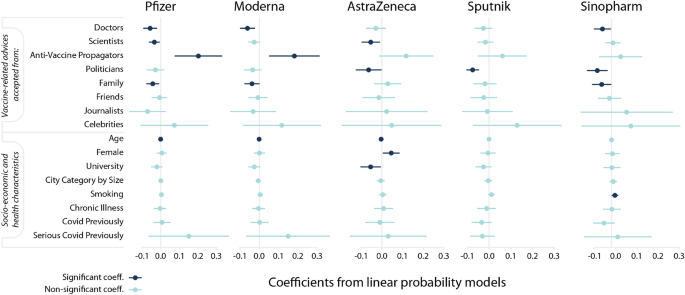
Source of advice taken characterize hesitancy against vaccines differently. Estimation results from linear probability models with robust standard errors. The dependent variable equals 1 if the respondent evaluates a vaccine type unacceptable and 0 otherwise. Markers denote point estimates and 95% confidence intervals are denoted by the bars. Non-significant coefficients are in light blue ((pge 0.05)); significant coefficients are in dark-blue ((p<0.05)).
Next, we estimate linear probability models (LPM) to analyze how different factors shape the evaluation of each vaccine individually. Independent variables include “Advice” dummy variables that take value 1 if the individual follows the advice of the denoted source. “Age” is a numeric variable; it is measured in years and is expected to correlate negatively with hesitancy. “Female” takes value 1 if the respondent is woman and zero otherwise. “University” equals 1 if the respondent has a university degree or equivalent and is expected to correlate negatively with hesitancy. We include health-related information as well. “Smoking” and “Chronic Illness” are binary variables as well as “COVID Previously” and “Serious COVID previously”. We present the summary statistics in Supporting Information 4, which also contains a correlation matrix and VIF statistics. The latter tests indicate no issues of multicollinearity. The estimation specification can be found in “Methods”.
Figure 3 shows the point estimates and the (95%) confidence intervals calculated from the heteroscedasticity-robust standard errors (for detailed results see Table S3 in Supporting Information 5). The results suggest that the driving factors of rejecting a decision differ among vaccine types. Those who trust the advice of anti-vaccine propagators are 18.2 and 20.2 percent more likely to evaluate mRNA vaccines (Pfizer and Moderna) unacceptable. Trusting the doctors’ advice, however, decreases the hesitancy probability by 5.7, 6.1, and 5.4 percent for Pfizer, Moderna, and Sinopharm, respectively. Trusting scientists reduce the likelihood of evaluating a vaccine unacceptable by 3.5, 2.6 and 5.5 per cent for Pfizer, Moderna, and AstraZeneca, respectively. Those who take advice from politicians are 6.4, 7.6 and 8.4 percent more likely to evaluate AstraZeneca, Sputnik and Sinopharm acceptable, respectively. Those who trust their family’s advice are more likely to evaluate Pfizer, Moderna and Sinopharm acceptable by 4.3, 3.8 and 5.8 percent, respectively. The coefficients for the advice of celebrities are either not or only slightly significant. We find that the point estimates are large and positive for all types of vaccines.
Socio-demographic characteristics of respondents correlate with vaccine hesitancy in the following way. Age has negative correlation implying that more vulnerable, older individuals are less likely to evaluate vaccines unacceptable. Although the coefficient of age is small in Fig. 3, the regression on standardized variables reported in Table S3 (in Supporting Information 4) reveals that age is an important factor for evaluating Pfizer, Moderna and AstraZeneca acceptable. Women are more likely to evaluate AstraZeneca unacceptable, probably due to reported cases of females’ blood clot (https://www.reuters.com/business/healthcare-pharmaceuticals/uk-regulator-says-some-evidence-astrazeneca-clots-occur-more-women-than-men-2021-05-06/). Note that a meta-analysis9 found an overall significant gender difference with males being on average 41% more likely to report that they intended to receive a vaccine than females. Our results can indicate that this extra hesitancy for females might come from the different risk-tolerance regarding serious side-effects. University degree, however, decreases hesitancy towards AstraZeneca.
We have carried out the following robustness checks in Supporting Information 5. First, we show that our regression results hold if we use a logistic regression specification instead of ordinary least squares (both of these specifications have been used previously to examine vaccine acceptance35). Second, our results remain similar after including subjective wealth as a control variable. A potential limitation of our study could be from “spreading of the alternatives”36, which means that after a difficult decision making, individuals tend to value the accepted alternative better and the rejected alternative worse. However, our results do not change if we apply the models on a subsample of those who stated that they had stable vaccine assessment over the time.
Individual selection improves vaccine assessment
To better understand how free choice across vaccines is related to their acceptance, we analyze individuals’ vaccine evaluation values on a scale from (1) to (5) sorted by the received and the rejected vaccines. Figure 4 summarizes the vaccine evaluations in the form of a heat map. A heat map cell corresponds to the average rating of a type of vaccine. The row denotes the average evaluation for that vaccine among the vaccine group of patients denoted by the column. Supporting Information 6 contains summary statistics of vaccine assessments depicted in Fig. 4.
In Fig. 4A, we consider individuals who accepted their first vaccine offer. Notice that Pfizer has the highest average ratings across all columns. This implies that free vaccine choice does not necessarily mean that everyone gets the most preferred vaccine. Instead, individuals make an uncertain decision considering the acceptable alternatives and the unknown waiting times between the sequential vaccine offers. In the Supporting Information 7, Table S13 presents the distribution of the most preferred vaccine when the accepted vaccine is not the most highly-rated vaccine. We infer that patients were willing to accept a vaccine other than the preferred Pfizer or Moderna to avoid the long anticipated waiting times. In Table S14, we show that patients had to wait almost (2.76) weeks on average to get their most preferred vaccine if they rejected a less preferred vaccine. In Table S15, we also present evidence that the anticipated waiting times closely follow the actual waiting times on average. That is, if a patient accepts the first vaccine offer then the following conditions must hold; the patient prefers the accepted vaccine to the other vaccines or she has a belief that a more preferred vaccine, which is likely to be Pfizer and Moderna, will not be offered anytime soon. We provide an extended analysis in the Supporting Information 7.
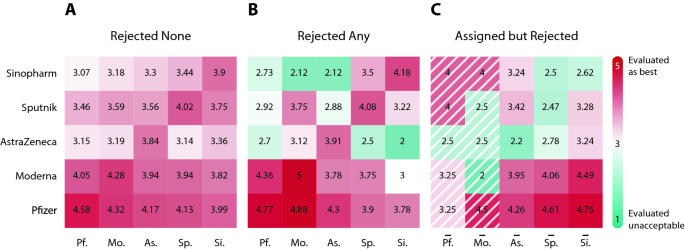
Average vaccine rating by assigned, re-selected and rejected vaccines show polarization of vaccine hesitancy. Individuals are grouped by columns of received vaccine in (A) and (B) and by columns of assigned vaccine in (C) (marked by overline). Rows correspond to average rating of a certain vaccine. (A) Ratings of those patients who accepted their first vaccine offer suggest that Pfizer and Moderna were the best assessed vaccines. (B) Ratings of those patients who rejected at least one assigned vaccine reveal that re-selection of vaccines is paired with better assessment of the received vaccine. (C) Ratings of those patients who rejected at least one assigned vaccine illustrate polarization of hesitancy by vaccine types. The average rating in the first two shaded columns are calculated from few observations only.
Figure 4B shows the ratings of those patients who rejected at least one vaccine. We see that the diagonal values in Fig. 4B are slightly higher than the ones in Fig. 4A. This implies that the individuals who rejected a vaccine before value their received vaccine slightly higher than those who accepted their first vaccine. Figure 4B also shows a high level of dislike towards AstraZeneca, Sinopharm and somewhat Sputnik when it comes to rating vaccines other than the accepted vaccine.
Comparing the values on Fig. 4A,B, we can see fundamental differences between the rejected none and rejected any groups. Based on the values on the diagonal, those individuals who rejected at least one vaccine rated the received vaccine higher than those who accepted the first vaccine offer. Looking at the off-diagonal, we see that the rejected any group tends to rate the non-accepted vaccines to be worse. For instance, the mean ratings for AstraZeneca at the off-diagonal are strictly smaller among those individuals who rejected a vaccine at least once than among those who accepted their first offer. We can also see the individuals who received Sinopharm after rejection tend to rate other vaccines worse than those who accepted Sinopharm in their first offer.
Figure 4C highlights the benefits of free choice. We group individuals based on the first vaccine offer rejection denoted by the columns. We implicitly assume here that the vaccine registration is not affected by the government’s decision to allow free choice. Let us point out that the number of observations is small for the Pfizer and the Moderna groups with only (6) and (2) observations, respectively. In other words, patients rarely reject Pfizer or Moderna when these vaccines are offered for the first time. Focusing on the AstraZeneca, Sputnik and Sinopharm columns, we see that the values for the assigned vaccines on the diagonal are strictly smaller than any of alternatives. We can also see a strong preference towards Pfizer and Moderna from the AstraZeneca, the Sputnik and the Sinopharm columns. Figure 4C suggests that free choice significantly increased the efficiency of vaccine allocation. This follows from enabling the re-selection of acceptable vaccines.
We report how assessment of vaccines have changed over the third wave in Supporting Information 7. The ratio of patients who changed their assessment over time for a specific vaccine stays below 5 percent of the total sample. We can only see a large negative change in the case of the AstraZeneca reaching 10 percent of the sample. This is most likely a result of the news about the possible side effects. Finally, Supporting Information 8 contains a preference analysis of those individuals who were not vaccinated but evaluated minimum 2 but maximum 3 of the investigated vaccines acceptable. This enables us to look at co-acceptance among vaccines. In Fig. S7 we find that the most common co-acceptance link is between Pfizer and Moderna. The Sputnik-Sinopharm co-acceptance link is the most frequent one that does not include Pfizer. This suggests that a wide and diverse vaccine portfolio is preferred in a society where vaccine preferences diverge.
