Official Gov. data suggests COVID Vaccines take 5 Months to Kill but 20,000+ Excess Deaths in the UK since May 2022 proves it
According to the UK Government’s Office for National Statistics, there have been 20,000 excess deaths in England and Wales since May 2022 compared to the previous five-year average. Further data provided by Scotland shows an additional 1,500 excess deaths in the same time frame.
Further data published by the Office for National Statistics also show that mortality rates per 100,000 are highest among the vaccinated population in England. An analysis of those figures found it takes approximately 5 months from receiving the Covid-19 vaccine for that elevated mortality rate to be realised.
With a mass Covid-19 “booster” campaign taking place in December 2021, the 20,000+ excess deaths recorded since May 2022, is further damning evidence that Covid-19 injections take five months to kill.
The Office for National Statistics (ONS) publishes weekly figures on deaths registered in England and Wales. The most recent data shows deaths up to 12th August 2022.
The most recent week shows that there were 10,355 deaths in England and Wales, equating to 950 excess deaths against the five-year average.
But this is a trend that has been occurring since the end of April 2022. The following chart, created by the ONS, shows the number of deaths per week compared to the 5-year average since the beginning of 2020 –
As you can see from the above, England and Wales were recording excess deaths throughout the majority of 2021 before they suddenly fell below the five-year average at the start of 2022. But this is only because the ONS decided to change the five-year average to include 2021, and as you can see from the above there were tens of thousands of excess deaths in England and Wales at the beginning of 2021.
However, as you can also see from the above, recess deaths suddenly began to rise again at some point in 2022, and have failed to subside. By looking at the actual dataset published by the ONS, we can see when that rise began.
The 2022 edition of the Deaths registered weekly in England and Wales can be downloaded here or accessed on the ONS website here.
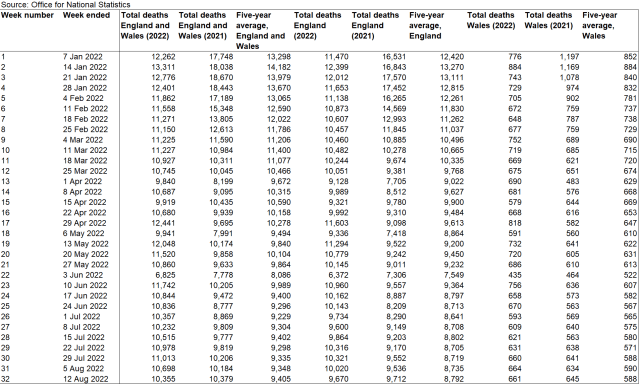
Table 1 of the dataset contains ‘weekly provisional figures on death registrations in England and Wales, registered 2021 and 2022 and five-year averages’.
From the week ending 22nd April 2022, excess deaths have been recorded every single week in England and Wales.
The following chart shows the total number of deaths between the week ending 22nd April and the week ending 12th August compared to the five-year average –
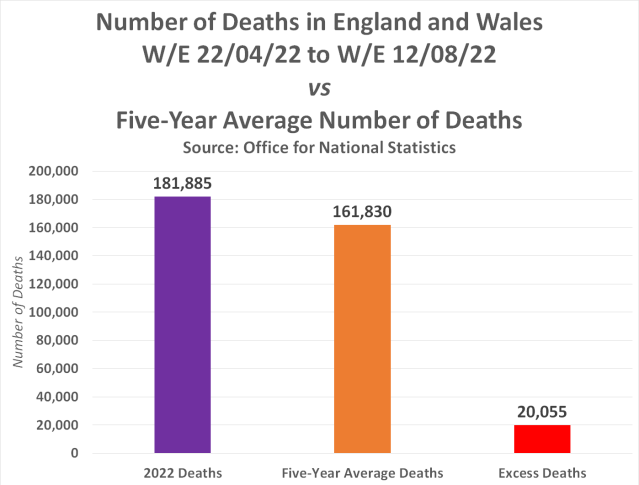
In all, there have been 181,885 recorded deaths since the 22nd of April. But the five-year average number of deaths, which includes the year 2021 where excess deaths were recorded all year, equates to just 161,830 deaths. This means there have been 20,055 excess deaths in England and Wales since the end of April.
The question is, why?
Further evidence published by the Office for National Statistics suggests it is because of Covid-19 vaccination.
Onthe 6th July, the ONS published a dataset containing a whole host of horrifying data on deaths by vaccination status in England between 1st Jan 2021 and 31st May 2022.
Table 1 of the ONS dataset contains figures on the monthly age-standardised mortality rates by vaccination status for deaths between 1st Jan 21 and 31st May 22. The first Covid-19 injection was administered in England on 8th December 2021, and here are the figures on mortality rates by vaccination status in the following 4 months –
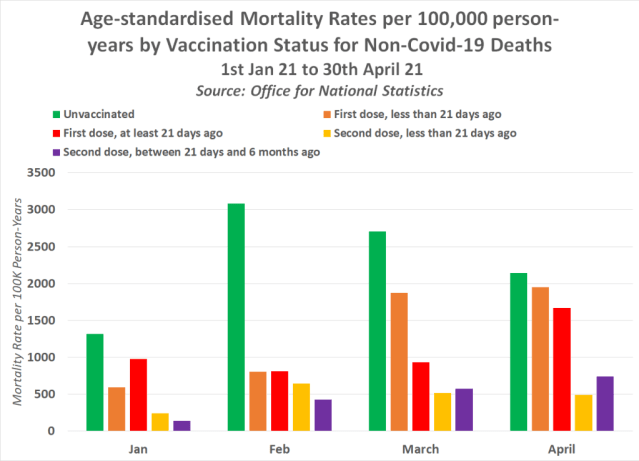
All of a sudden, the vaccinated population as a whole were more likely to die than the unvaccinated of any cause other than Covid-19, and this trend has continued month after month since. It also turns out this trend tally’s up with those who received the Covid-19 injections first.
People in England were vaccinated by order of age, with the eldest being offered the Covid-19 injection first.
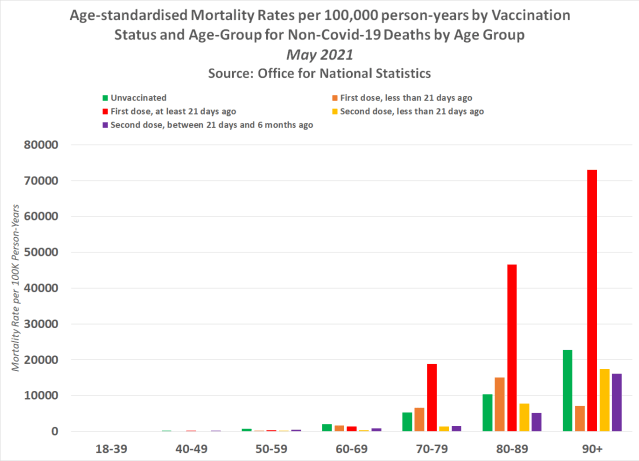
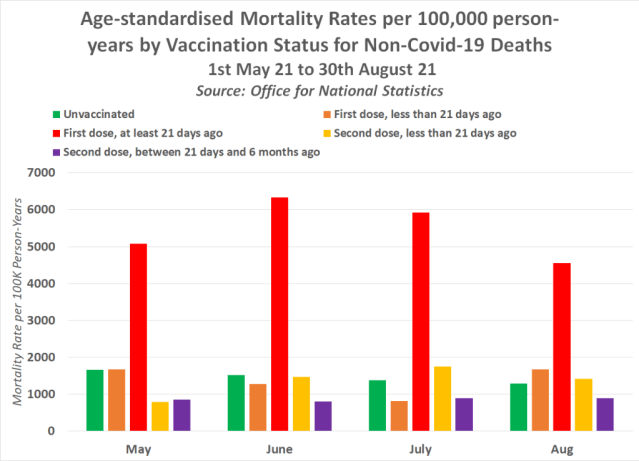
The following chart shows the age-standardised mortality rates per 100,000 person-years by vaccination status and age group for the month of May 2021 –
In December 2021, the UK Government offered a Covid-19 “Booster” jab to everybody. It was a free for all. Are we really to believe that it’s just a coincidence that the same ONS data shows mortality rates per 100k among the triple vaccinated began to overtake mortality rates among the unvaccinated from April and May 2022, approximately five months later?
The following chart shows the monthly age-standardised mortality rates by vaccination status among 40-49-year-olds for Non-Covid-19 deaths in England between January and May 2022 –
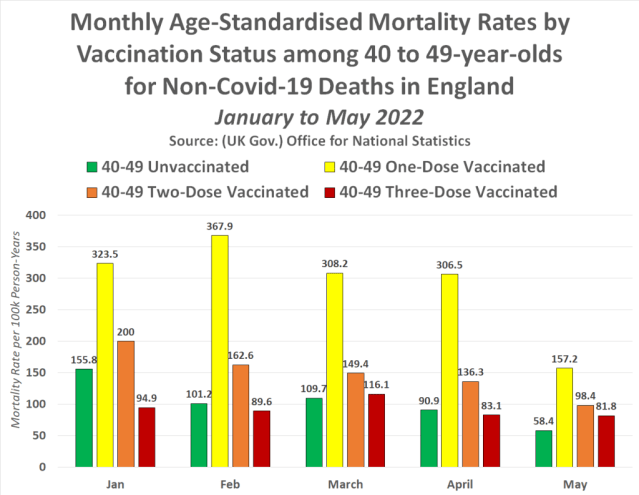
As you can see from the above, the triple vaccinated mortality rate surpassed the unvaccinated mortality rate in May 2022, five months after the Covid-19 booster campaign.
The following chart shows the monthly age-standardised mortality rates by vaccination status among 50 to 59-year-olds for Non-Covid-19 deaths in England between January and May 2022 –
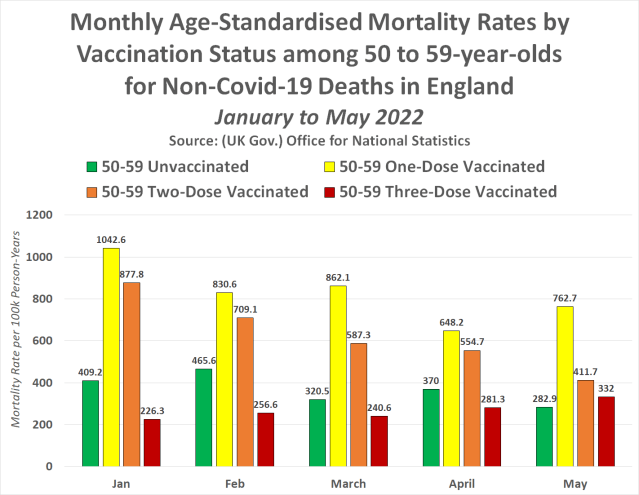
Yet again we see the same pattern. The ONS data shows the same for the triple vaccinated among every single age group from either April or May 2022. Just as it did in 2021, approximately five months after the first vaccination was administered.
So it should come as no surprise as to why approximately five months after the Covid-19 booster campaign, England and Wales began to record excess deaths again against the five-year average, with over 20,000 excess deaths being recorded as of 12th August.
It’s because the Covid-19 injections take approximately five months to kill recipients.

