Mapping global acceptance and uptake of COVID-19 vaccination: A systematic review and meta-analysis | Communications Medicine
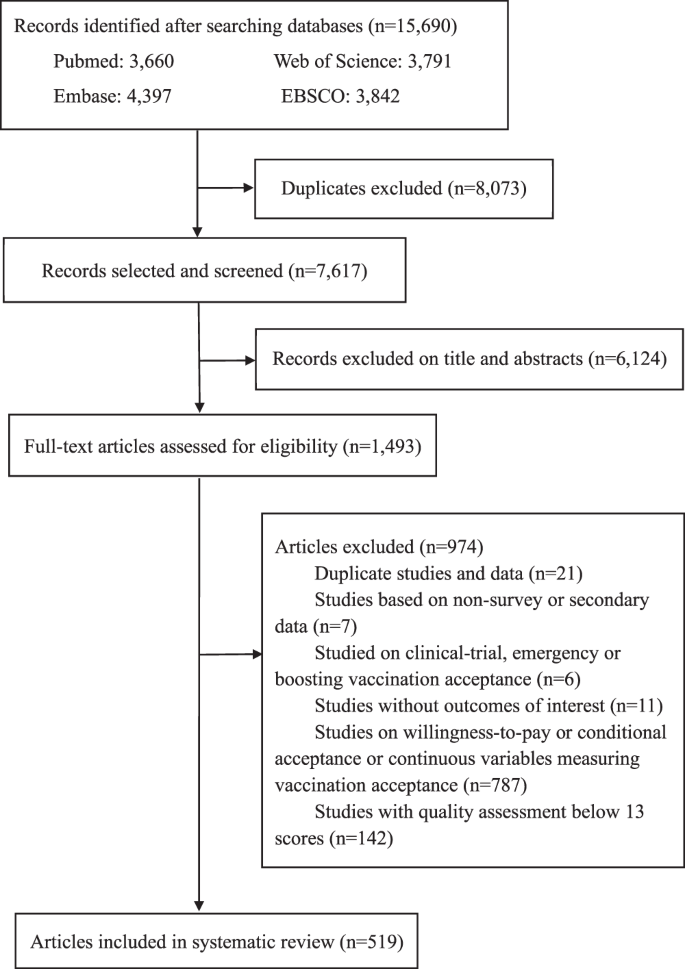
A total of 15690 articles were identified through database searches. After excluding 8073 duplicates and a further 6124 from the screening of titles and abstracts, 1493 articles were full-text screened for eligibility (Fig. 1). Ultimately 519 articles were eligible for inclusion, with 7,990,117 participants included in the meta-analysis (Supplementary Data 5). A total of 678 samples were included, as one study may contain several samples across different countries, survey times, and populations. Of 678 samples included, the majority were from the United States (n = 133), mainland China (n = 59), the United Kingdom (n = 24), Saudi Arabia (n = 40), India (n = 21), Italy (n = 20), Turkey (n = 18), Canada (n = 17), Australia (n = 16), and Bangladesh (n = 13). The survey time of the included studies covered January 2020 to December 2021. About two thirds of studies (46.2%, 240/519) described results of COVID-19 vaccination acceptance from convenience samples, while 110 studies (21.2%) used purposive sampling to select study participants.
Global acceptance and uptake of COVID-19 vaccination
Among the 519 studies with a score > 12, 476 studies investigated the willingness of COVID-19 vaccination, and reported that the pooled acceptance rate of COVID-19 vaccination was 67.8% (95% CI: 67.1–68.6) (Table 1). Acceptance rates varied among different populations; children and adolescents (70.7%, 67.6–73.9) had the highest acceptance rate, followed by adults (69.1%, 68.2–70.1), university students (67.7%, 62.7–72.8), healthcare workers (67.5%, 64.4–70.6), and patients with chronic disease (67.4%, 63.9–70.9), while pregnant/breastfeeding women (54.0%, 46.3–61.7) had the lowest acceptance rate.
404 of 519 studies investigated the proportion of participants who were unwilling to get a COVID-19 vaccine, and found the pooled level to be 20.4% (95% CI:19.6–21.3), as shown in Table 1. The proportion of participants who were unwilling to get a COVID-19 vaccine ranked from high to low for pregnant/breastfeeding women (41.9%, 33.0–50.8), university students (20.7%, 17.2–24.2), adults (19.8%, 18.5–21.1), children and adolescents (19.8%, 17.9–21.7), healthcare workers (19.8%, 17.7–21.9), and patients with chronic diseases (16.9%, 13.9–19.9).
139 of 519 studies investigated the uptake of COVID-19 vaccination, and reported that the pooled uptake rate was 42.3% (95% CI: 38.2–46.5) until November, 2021 (Table 1). Healthcare workers (54.1%, 46.5–61.7) had the highest uptake rate, followed by university students (43.7%, 31.2–56.1), adults (39.7%, 32.4–47.1), patients with chronic disease (39.3%, 31.9–46.7), and children and adolescents (37.9%, 22.5–53.4), while pregnant/breastfeeding women (7.3%, 1.7–12.8) had the lowest uptake rate.
Cross-country comparison of COVID-19 vaccination acceptance
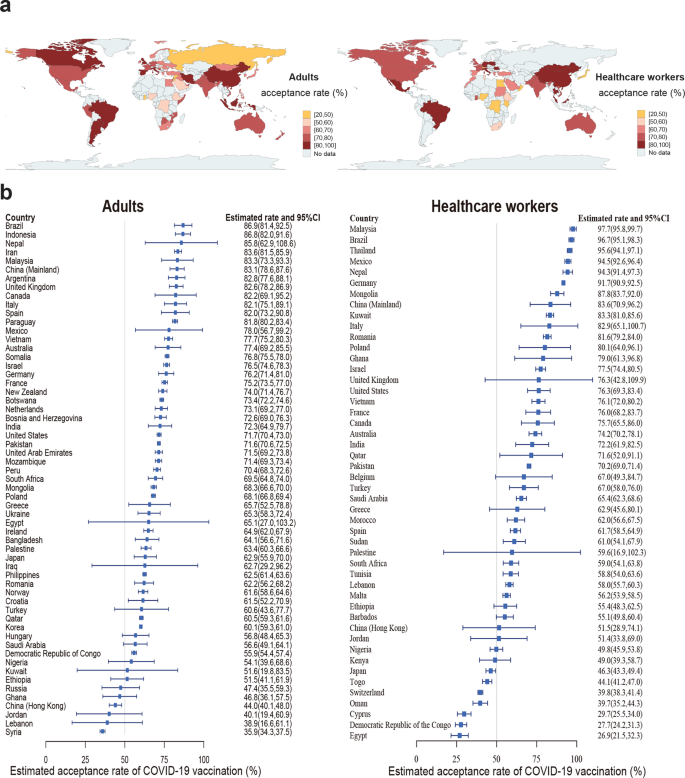
Among adults in the 58 studied countries, Brazil reported the highest acceptance (86.9%, 81.4–92.5), while Syria reported the lowest acceptance (35.9%, 34.3–37.5) (Fig. 2, Sheet 3 in Supplementary Data 2). Vaccination acceptance rates varied across the 58 countries: 12 countries exceeded 80% (Brazil, Indonesia, Nepal, Iran, Malaysia, mainland China, Argentina, UK, Canada, Italy, Spain, Paraguay); 17 countries were between 70% and 80% (Mexico, Vietnam, Australia, Somalia, Israel, Germany, France, New Zealand, Botswana, Netherlands, Bosnia and Herzegovina, India, USA, Pakistan, United Arab Emirates, Mozambique, Peru); 18 countries were between 60% and 70% (South Africa, Mongolia, Poland, Greece, Ukraine, Egypt, Ireland, Bangladesh, Palestine, Japan, Iraq, Philippines, Romania, Norway, Croatia, Turkey, Qatar, Korea); another 6 countries were between 50% and 60% (Hungary, Saudi Arabia, Democratic Republic of Congo, Nigeria, Kuwait, Ethiopia); and the remaining 5 countries were below 50% (Russia, Ghana, Jordan, Lebanon, Syria).
a Estimated COVID-19 vaccination acceptance rates among adults (n = 6,538,325) and healthcare workers (n = 128,515) across countries are shown via map. Different colors refer to different levels of acceptance rates. b Estimated COVID-19 vaccination acceptance rates and 95% confidence interval (CI) in adults (n = 6,538,325) and healthcare workers (n = 128,515) across countries are shown.
Among healthcare workers in the 47 studied countries, the acceptance rate of COVID-19 vaccination was the highest in Malaysia (97.7%, 95.8–99.7), and the lowest in Egypt (26.9%, 21.5–32.3). Vaccination acceptance rates also varied across the 47 countries: 12 countries exceeded 80% (Malaysia, Brazil, Thailand, Mexico, Nepal, Germany, Mongolia, mainland China, Kuwait, Italy, Romania, Poland); 11 countries were between 70% and 80% (Ghana, Israel. UK, USA, Vietnam, France, Canada, Australia, India, Qatar, Pakistan); 7 countries were between 60% and 70% (Belgium, Turkey, Saudi Arabia, Greece, Morocco, Spain, Sudan); 8 countries were between 50% and 60% (Palestine, South Africa, Tunisia, Lebanon, Malta, Ethiopia, Barbados, Jordan); and the remaining 9 countries were below 50% (Nigeria, Kenya, Japan, Togo, Switzerland, Oman, Cyprus, Democratic Republic of the Congo, Egypt).
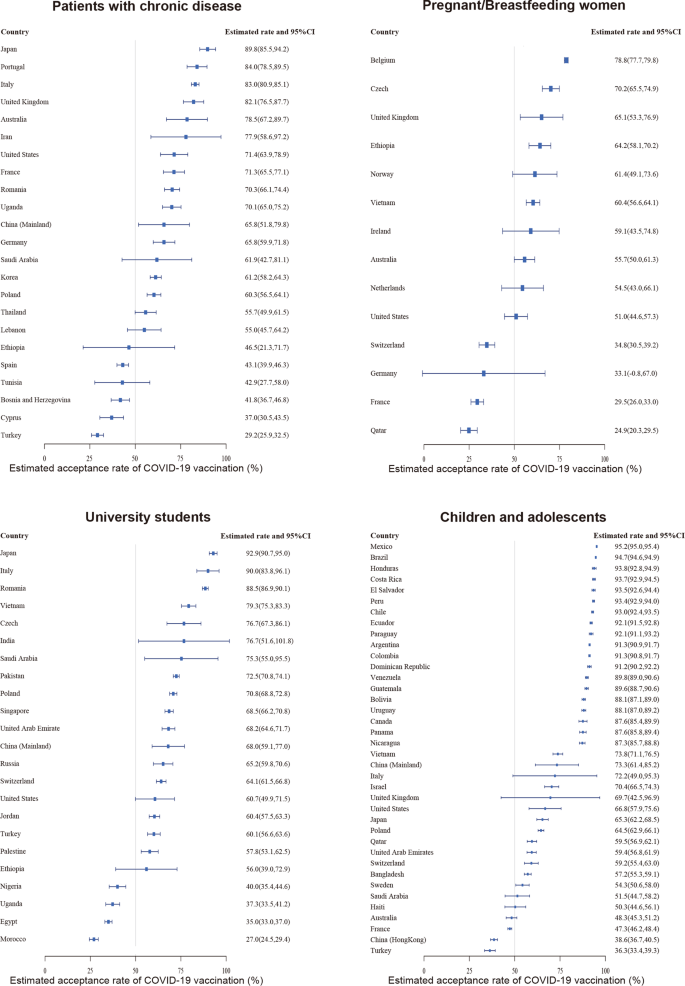
Among patients with chronic diseases in the 23 studied countries, Japan reported the highest acceptance rate (89.8%, 85.5–94.2), while Turkey reported the lowest acceptance rate (29.2%, 25.9–32.5) (Fig. 3, Sheet 3 in Supplementary Data 2). Among pregnant or breastfeeding women, Belgium had the highest acceptance rate (78.8%, 77.7–79.8) among the 14 studied countries, whereas Qatar had the lowest (24.9%, 20.3–29.5). Among university students across the 23 studied countries, Japan had the highest acceptance rate (92.9%, 90.7–95.0), while Morocco had the lowest acceptance (27.0%, 24.5–29.4). Among children and adolescents in the 37 studied countries, Mexico reported the highest acceptance rate (95.2%, 95.0–95.4), while Turkey reported the lowest acceptance (36.3%, 33.4–39.3).
Estimated COVID-19 vaccination acceptance rates and 95% confidence interval (CI) in different populations across countries are shown. The populations include patients with chronic disease (n = 165,438), pregnant/breastfeeding women (n = 25,102), university students (n = 43,832), and children and adolescents (n = 358,429).
Time trends of COVID-19 vaccination acceptance
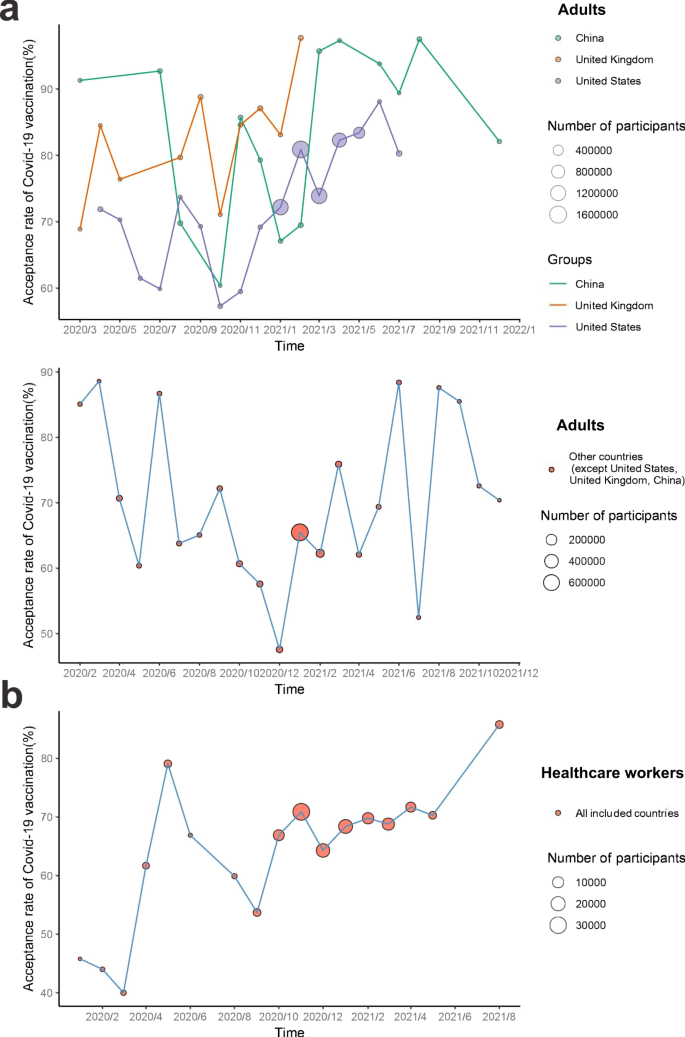
Figure 4 and Sheet 4 in Supplementary Data 2 display time trends for COVID-19 vaccination acceptance among adults and healthcare workers. Among adults, COVID-19 vaccination acceptance fell globally between February and December, 2020, then recovered during December 2020 to June 2021, and further dropped in late 2021. In the United States, the acceptance rate of COVID-19 vaccination first declined from 71.9% (95% CI 66.3-77.6) in April to 57.3% (53.2–61.5) in October, 2020, then increased to 88.1% (84.5–91.6) in June, 2021. The acceptance rate of COVID-19 vaccination across the United Kingdom dropped from 84.5% (73.1–95.8) to71.1% (69.5–72.8) during the period from April to October, 2020, and then increased to 97.7% (97.5–97.9) in February, 2021. In China, the acceptance rate of COVID-19 vaccination showed a decreasing trend from 91.3% (90.1–92.5) to 60.4% (57.3–63.4) from March to October, 2020, then recovered to 97.5% (97.3–97.8) in August, 2021, and further dropped in December, 2021. As for the remaining studied countries except the United States, the United Kingdom, and China, it declined from 70.7% (66.0–75.4) to 47.6% (37.0–58.1) from April to December, 2020, then increased to 88.4% (82.0–94.8) in June, 2021, and further experienced some drops in the second half of 2021. In addition, time trends for COVID-19 vaccination acceptance among healthcare workers declined from 79.1% (68.9-89.4) to 53.7% (48.7–58.7) from May to September, 2020, then continuously increased to 85.8 (84.6–87.0) in August, 2021.
a Time trends of COVID-19 vaccination acceptance for adults by country are shown in line graphs. Different colors refer to different countries, including China (n = 358,429 participants), the United Kingdom (n = 105,593 participants), the United States (n = 5,816,222 participants), and other countries (n = 1,008,126 participants). b Time trend for healthcare workers (n = 128,090) in all included countries is shown. Size of circles refers to number of study participants.
Comparison of COVID-19 vaccination acceptance and uptake by sociodemographic subgroups
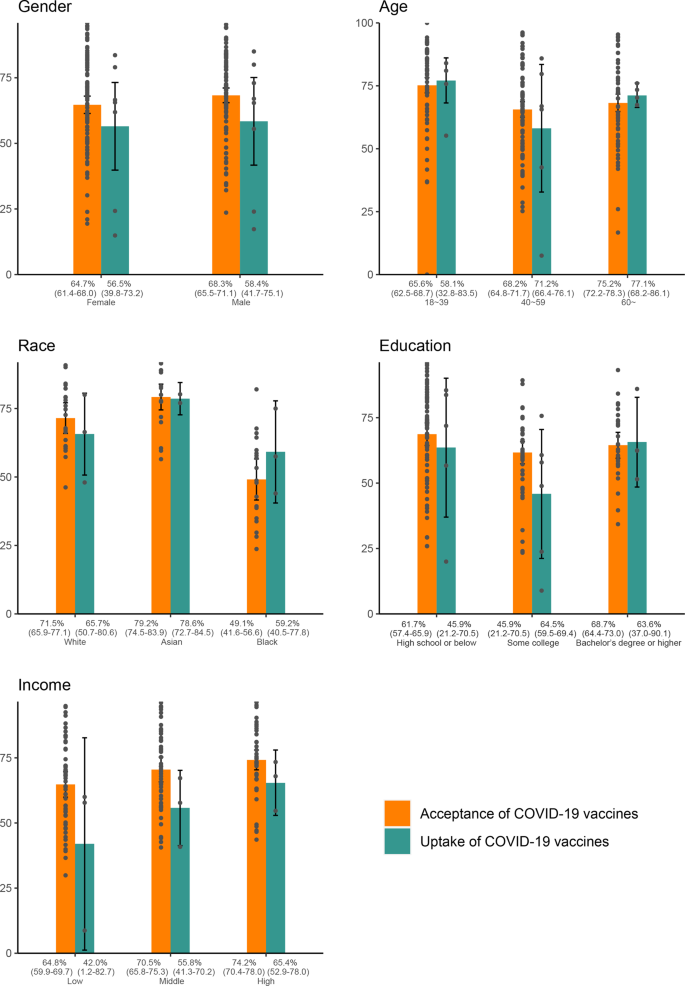
Among adults, the COVID-19 vaccination acceptance rate of males (68.3%, 65.5–71.1) was higher than females (64.7%, 61.4–68.0) (Fig. 5, Sheet 5 in Supplementary Data 2). Those over 60-years-old (75.2%, 72.2–78.3) had the highest rate, following by those 40~59-years-old (68.2%, 64.8–71.7), and those 18~39-years-old (65.6%, 62.5–68.7). Asians (79.2%, 74.5–83.9) had the highest rate, while Black individuals (49.1%, 41.6–56.6) had the lowest rate. Acceptance rates of those with a high school or below education, those with some college, and those with a bachelor’s degree or higher were 61.7% (95% CI: 57.4–65.9), 64.5% (95%CI: 59.5–69.4), 68.7% (95%CI: 64.4–73.0) respectively. People with high incomes (74.2%, 70.4–78.0) had the highest rate, followed by those with middle incomes (70.5%, 65.8–75.3), and low incomes (64.8%, 59.9–69.7).
Estimated acceptance (orange block) and uptake (green block) rates and 95% confidence interval (CI) of COVID-19 vaccination by subgroups for adults are shown. The subgroups include gender (n = 819,147 participants), age (n = 522,343 participants), race (n = 51,286 participants), education (n = 269,342 participants), and income (n = 298,195 participants).
In addition, the uptake rate of COVID-19 vaccination for the Black population (59.2%, 40.5–77.8) was lower than the white and Asian by 6.5% and 19.4% respectively. The uptake rate for the lowest-level groups of education or income (around 45%) was lower than the highest-level groups by around 20%.
This article has been archived for your research. The original version from Nature.com can be found here.
