Fact Check: Mike Lindell’s 2022 Midterm Election Graphs Do NOT Prove Races Were Stolen
Do midterm election graphs of unofficial, private election tallies used by My Pillow CEO Mike Lindell on social media and on his Frank Speech website prove 2022 elections were stolen? No, that’s not true: Spikes in the vote counts are a normal part of clean elections. A Lindell ally said he scraped and graphed data that Edison Research supplies to news organization websites and found anomalous spikes.
However, the pace at which that tally changes is under Edison’s control, not the control of election officials. As in past elections, would-be cyber sleuths use sharp upticks in private data feeds — particularly Democrats’ vote tallies — as proof there has been wide-scale voter fraud. Logically, though, updates to the line graph of Edison’s running tally can vary dramatically depending on when Edison staff add them into Edison’s data stream and depending on the size and the demographics of the precincts that are reporting at any given time.
This is what audits of election results have shown: As Election Night winds down, the addition of tallies from big towns cause big bumps, and areas with strong partisan affiliation will cause unequal bumps in candidates’ accumulation of votes.
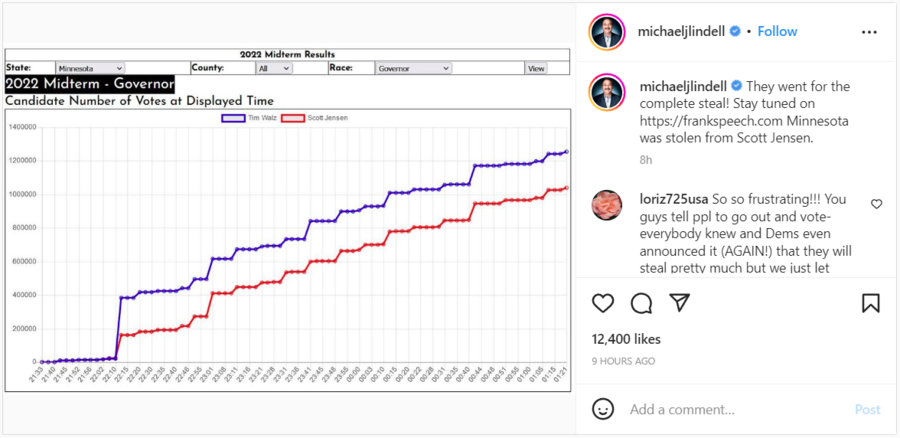
One of the fraud claims, concerning the Minnesota gubernatorial race, appeared in an Instagram post published by Lindell on November 9, 2022. It opened:
This is what the post looked like on Instagram at the time of writing:
(Source: Instagram screenshot taken on Wed Nov 9 15:38:51 2022 UTC)
The graph
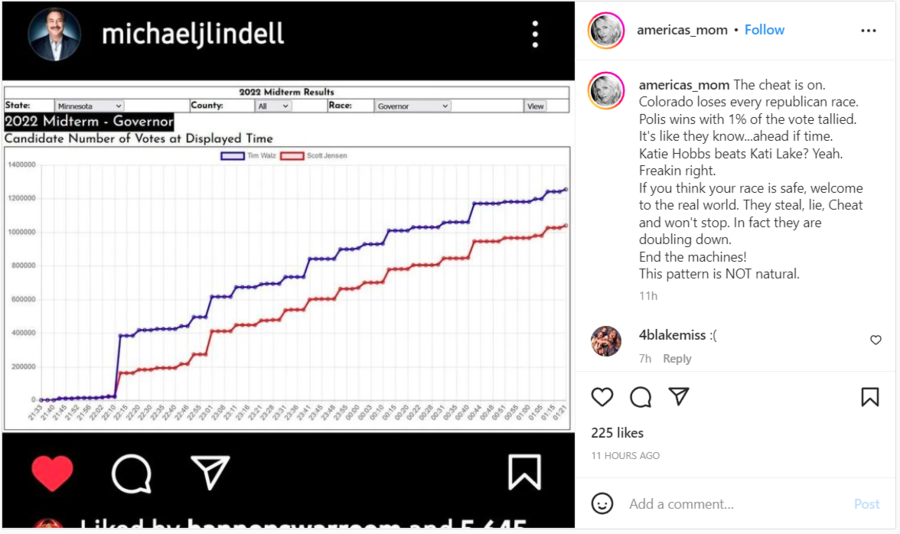
The graph was shared widely on social media, including a similar post that was also circulating on Instagram:
(Source: Instagram screenshot taken on Wed Nov 9 22:39:44 2022 UTC)
The graph in the first Instagram post charts the vote tally in the Minnesota governor’s race between Republican Scott Jensen (red line) and Democrat Tim Walz (blue line) over the course of Election Day on November 8, 2022, and into the next morning.
Other than saying, “They went for the complete steal,” Lindell doesn’t explain what was improper or how the lines on the graph indicated vote stealing.
Early in the counting, when few votes were tabulated, Jensen and Walz were neck-and-neck, but incumbent Walz later took a lead as larger blocs of votes came in. With 99 percent of the vote counted, the election statistics team at The Associated Press called the race for Walz with 52.3 percent to 44.6 percent for Jensen.
Lindell Claim Based on “Scraped” Data
“Scraping” is a process by which website data is automatically copied and translated into human-readable form. Several November 9, 2022, statements on FrankTV by Lindell and by Jeffrey O’Donnell, who describes himself as a data analyst, gave “Edison Data” as the source for the numbers in the graph.
Lindell texted Lead Stories after publication of the first version of this fact check to say the data were taken from CNN, not from The New York Times, as Lead Stories had initially reported. Edison provided election data to CNN and not to The New York Times, Edison Executive Vice President Rob Farbman told Lead Stories in a November 9, 2022, email.
Scraping is not clearly illegal or even opposed by website operators. Election outcome deniers scrape instead of paying for a data feed of their own from Edison or the Associated Press. But, even if they paid, private company data feeds do not provide an official record of the pace or order of official ballot counts.
The first problem with private data is it is vulnerable to human error. In 2020, for instance, Edison stated that a clerical error, though corrected in minutes, caused hiccups in graphics that are automated to be redrawn constantly, based on the data stream. Scraped data is a record of what a private data company has collected and transmitted to clients and would be the equivalent of hearsay evidence if one were accusing election officials of vote fraud.
The other weakness in scraped data is that it may not mirror the pace of vote counting. Edison’s team quickly collects new totals announced in counties all over the country during the counting process, but even if perfectly copied, there is no guarantee those data are added in the same order as state officials’ running tally.
But, like Lindell and O’Donnell, other commenters on social media said sharp upticks in vote tallies on the graphs are “unnatural,” as if some kind of carburetor regulates the flow from big and small towns so that they all are added at the same steady rate.
They are not. A conservative Wisconsin group’s audit of the 2020 election tally showed there was no basis for claims of improper “ballot dumps” that were, similarly, based on spikes in the timeline of vote counting.
Similarly, the Michigan Senate’s Republican-controlled Oversight Committee investigated 2020 allegations that big spikes in the incremental tally proved fraud, and found no evidence to support that theory, scolding those who used tally graphs to make unfounded claims:
Large spikes in the vote count are not necessarily unexplainable or unusual. They do not alone constitute evidence of fraud and can be reasonably expected.
The 2022 claims based on data spikes recycle false claims made in 2020 that there was a clandestine “dump” of fake ballots in Wisconsin and Michigan that caused a sharp spike in the line graph of votes tallied over time. In that example, independent election observers and professional election administrators in Michigan and Wisconsin pointed out that in every election, large changes in vote totals correspond to the counting of big batches of votes from cities and of absentee ballots, which are added into the totals all at once.
In November 2020, Lead Stories debunked a claim similar to the one being promoted in social media and on Lindell’s TV show, which also used Edison data to say there was evidence of “millions of vote shifts” that stole the presidency from incumbent Donald Trump. But, an analysis of that claim by Lead Stories revealed that conspiracy theorists had improperly applied Edison’s rounded-off fractions (for use in pie chart graphics) to the total number of votes overall. That method will almost always yield inaccurate totals for each candidate.
Edison Research
Edison Research is a private company that conducts market research and political polling. Edison offers delegate estimates, Election Day exit polling and election projections to The New York Times, ABC, CBS, CNN and NBC, among other news outlets. Edison is also one of several suppliers of vote tallies to news outlets nationwide on Election Day and through the counting period. As a private company, Edison tallies are not the official data. What they send out is customized in some cases to feed directly to customers’ individual graphic packages, where absolute numbers are rounded off and turned into pie charts, for instance.
Additional Lead Stories fact checks related to Edison Research can be found here.


