Fact Check: It’s NOT Suspicious – Just Factual — That Allegheny County Requested More Dem Mail-In Ballots Than Philadelphia Despite Having Fewer Dems

Was it suspicious that more Democrats in Allegheny County, Pennsylvania, requested mail-in ballots than Democrats in Philadelphia County, even though 273,765 fewer registered Democratic voters live in Allegheny County in 2022? No, that’s not true: This also happened in 2018 and 2016, according to a spokesperson for the Pennsylvania Department of State, who added, “There is no evidence of fraud.”
The implied claim appeared in two tweets (archived here and here) on November 8, 2022. They read:
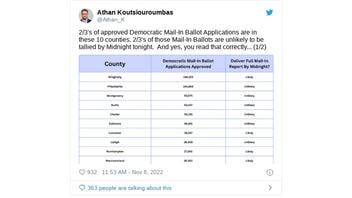
2/3’s of approved Democratic Mail-In Ballot Applications are in these 10 counties. 2/3’s of those Mail-In Ballots are unlikely to be tallied by Midnight tonight. And yes, you read that correctly… (1/2) …Allegheny County has more Democratic Mail-In Ballot Applications than Philadelphia County despite having 273,765 fewer registered Democratic voters. (2/2)
This is what the post looked like on Twitter at the time of writing:
(Source: Twitter screenshot taken on Wed Nov 9 15:56:56 2022 UTC)
The second tweet in this claim is a reply located underneath the first tweet. Although he doesn’t say so explicitly, the author of these tweets appears to be alluding to possible election manipulation by Pennsylvania Democrats in Allegheny County.
The claim focuses on requests for mail-in ballot from Democrats in the two counties — not votes actually cast in those counties — and this fact check will likewise focus on mail-in ballot requests.
A spokesperson for the Pennsylvania Department of State wrote to Lead Stories in a November 9, 2022, email:
There is nothing to explain. More Democrats requested a mail-in or absentee ballot in Allegheny County than in Philadelphia County. This was also true in 2016 and 2018, when Allegheny County voters requested more absentee ballots than Philadelphia voters. There is no evidence of fraud.
We sent another email asking for exact figures. In another November 9, 2022, email from the spokesperson, they wrote that the number of Democratic mail-in ballot applications approved as of November 7, 2022, were:
- Allegheny County: 144,447
- Philadelphia County: 142,798
In a November 10, 2022, Pennsylvania Department of State email, Lead Stories received more numbers from previous years’ Democratic absentee and mail-in ballots.
Democratic absentee ballots received for 2016 were:
- Allegheny: 19,361
- Philadelphia: 11,260
Democratic absentee ballots received for 2018 were:
- Allegheny: 15,670
- Philadelphia: 8,522
Democratic mail-in and absentee ballots combined received in 2020 were:
- Allegheny: 250,743
- Philadelphia: 312,399
The difference in registered Democratic voters in the two counties is accurate. Voter registration statistics by county (click on Voter registration statistics by county) shows that as of November 7, 2022, Allegheny County has 534,214 and Philadelphia County has 807,979.
Here, here and here are more Lead Stories fact checks about the Pennsylvania midterm elections of 2022.
This article has been archived for your research. The original version from Lead Stories can be found here.


