Government reports prove COVID Vaccination may have killed Millions & Confidential Pfizer Documents confirm your Government knew it would happen
Evidence discovered in quietly published Government reports confirms 1.8 million excess deaths have been recorded across the USA, Canada, Australia, New Zealand, the UK & most of Europe since the mass roll-out of the Covid-19 injections.
And evidence that can be found in the confidential Pfizer documents; that the U.S. Food & Drug Administration tried to conceal for a minimum of 75 years but was subsequently forced to publish by court order, confirms your Government knew this would happen and that this may well lead to depopulation.
Let’s not lose touch…Your Government and Big Tech are actively trying to censor the information reported by The Exposé to serve their own needs. Subscribe now to make sure you receive the latest uncensored news in your inbox…
Before we dive into the wealth of evidence we’d like to point out why it’s so important to read this investigation and share it as widely as possible.
We now know, for a fact, thanks to secret and hidden Government documents that ever since the Covid-19 injection was rolled-out, there have been an astounding 1.8 million excess deaths across the USA, Canada, New Zealand, Australia, the UK and 27 other countries in Europe.
That’s 1.8 million excess deaths across just 16% of all countries in the entire world. So just imagine how many more millions of people have lost their lives than would normally be expected.
You can find all the sources and a breakdown of the above figures further on in this extensive investigation. But it’s important that you know this now because these figures prove there were far more deaths in 2021 following the roll-out of the Covid-19 injections than there were in 2020 at the height of the alleged Covid-19 pandemic.
And the following documents analysed in this investigation prove that your Government, Medicine Regulators, and Big Pharma, not only knew that this would happen, but they also knew that this would most likely lead to mass depopulation.

The US Food and Drug Administration (FDA) attempted to delay the release of Pfizer’s COVID-19 vaccine safety data for 75 years despite approving the injection after only 108 days of safety review on December 11th, 2020.
But in early January 2022, Federal Judge Mark Pittman ordered them to release 55,000 pages per month. They released 12,000 pages by the end of January.
Since then, PHMPT has posted all of the documents on its website.
One of the documents contained in the data dump is ‘reissue_5.3.6 postmarketing experience.pdf’. Page 12 of the confidential document contains data on the use of the Pfizer Covid-19 injection in pregnancy and lactation.
Confidential Pfizer Documents reveal 90% of Covid Vaccinated Pregnant Women lost their Baby
Pfizer state in the document that by 28th February 2021 there were 270 known cases of exposure to the mRNA injection during pregnancy.
Forty-six percent of the mothers (124) exposed to the Pfizer Covid-19 injection suffered an adverse reaction.
Of those 124 mothers suffering an adverse reaction, 49 were considered non-serious adverse reactions, whereas 75 were considered serious. This means 58% of the mothers who reported suffering adverse reactions suffered a serious adverse event ranging from uterine contraction to foetal death.
A total of 4 serious foetus/baby cases were reported due to exposure to the Pfizer injection.

But here’s where things get rather concerning. Pfizer state that of the 270 pregnancies they have absolutely no idea what happened in 238 of them.
But here are the known outcomes of the remaining pregnancies –
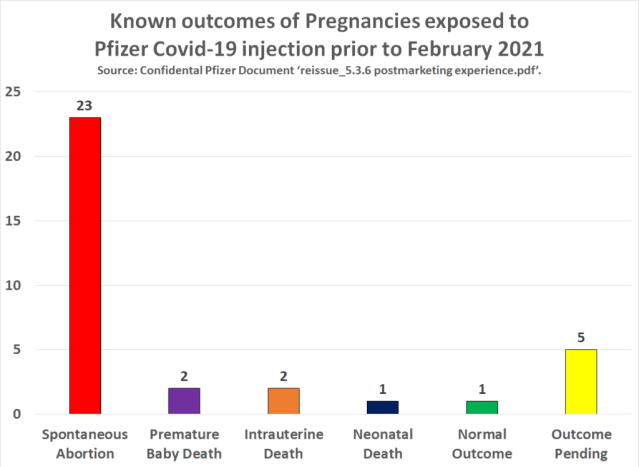
There were 34 outcomes altogether at the time of the report, but 5 of them were still pending. Pfizer noted that only 1 of the 29 known outcomes was normal, whilst 28 of the 29 outcomes resulted in the loss/death of the baby. This equates to 97% of all known outcomes of Covid-19 vaccination during pregnancy resulting in the loss of the child.
When we include the 5 cases where the outcome was still pending it equates to 82% of all outcomes of Covid-19 vaccination during pregnancy resulting in the loss of the child. This equates to an average of around 90% between the 82% and 97% figures.
So here we have our first piece of evidence that something is amiss when it comes to administering the Pfizer Covid-19 injection during pregnancy.
Here’s the guidance taken from the UK Government’s ‘REG 174 INFORMATION FOR UK HEALTHCARE PROFESSIONALS’ document –
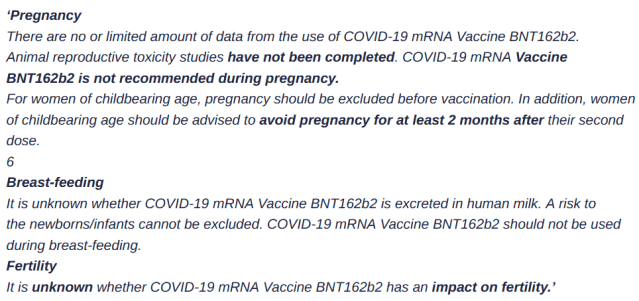
That’s how the guidance read in December 2020 anyway. Unfortunately, just a month or so later, the UK Government and other Governments around the world revised that guidance to read as follows –
This is still the official guidance as of June 2022, and leads to several questions requiring urgent answers when we consider since early 2021 pregnant women have been told Covid-19 vaccination is perfectly safe.
You only have to look at the things women were told to avoid during pregnancy prior to being told it’s perfectly safe to take an experimental injection to realise something just isn’t right here –
- Smoked fish,
- Soft cheese,
- Wet paint,
- Coffee,
- Herbal tea,
- Vitamin supplements,
- Processed Junk foods.
These are just to name a few, and the list is endless.
So let’s start with the ‘Pregnancy’ section of the official guidance. In December 2020 the guidance stated ‘Covid-19 vaccination is not recommended during pregnancy‘. Just a month or so later this guidance stated ‘Animal studies do not indicate harmful effects with respect to pregnancy etc.’
So let’s take a look at the animal studies in question.
But before we do it’s worth pointing out that the official guidance states, as of June 2022, that ‘administration of the COVID-19 mRNA Vaccine BNT162b2 in pregnancy should only be considered when the potential benefits outweigh any potential risks for the mother and foetus’. So why on earth has every single pregnant woman up and down the land been actively coerced into getting this injection?
Pfizer and Medicine Regulators hid dangers of Covid-19 Vaccination during Pregnancy due to Animal Study finding an increased risk of Birth Defects & Infertility
The limited animal study talked about in the official guidance actually uncovered the risk of significant harm to the developing foetus, but medicine regulators in the USA, UK and Australia actively chose to remove this information from public documents.
The actual study can be viewed in full here and is titled ‘Lack of effects on female fertility and prenatal and postnatal offspring development in rats with BNT162b2, a mRNA-based COVID-19 vaccine‘.
The study was performed on 42 female Wistar Han rats. Twenty-one were given the Pfizer Covid-19 injection, and 21 were not.
Here are the results of the study –
The results of the number of foetuses observed to have supernumerary lumbar ribs in the control group were 3/3 (2.1). But the results of the number of foetuses to have supernumerary lumbar ribs in the vaccinated group were 6/12 (8.3). Therefore on average, the rate of occurrence was 295% higher in the vaccinated group.
Supernumerary ribs also called accessory ribs are an uncommon variant of extra ribs arising most commonly from the cervical or lumbar vertebrae.
So what this study found is evidence of abnormal foetal formation and birth defects caused by the Pfizer Covid-19 injection.
But the abnormal findings of the study don’t end there. The ‘pre-implantation loss’ rate in the vaccinated group of rats was double that of the control group.
Pre-implantation loss refers to fertilised ova that fail to implant. Therefore, this study suggests that the Pfizer Covid-19 injection reduces the chances of a woman being able to get pregnant. So, therefore, increases the risk of infertility.
So with this being the case, how on earth have medicine regulators around the world managed to state in their official guidance that “Animal studies do not indicate direct or indirect harmful effects with respect to pregnancy”? And how have they managed to state “It is unknown whether the Pfizer vaccine has an impact on fertility“?
The truth of the matter is that they actively chose to cover it up.
We know this thanks to a ‘Freedom of Information (FOI) request made to the Australian Government Department of Health Therapeutic Goods Administration (TGA).
A document titled ‘Delegate’s Overview and Request for ACV’s Advice‘ that was created on 11th January 2021 was published under the FOI request. Page 30 onwards of the document shows a ‘review of the product information’, and highlights changes that should be made to the ‘Non-clinical evaluation report’ prior to official publication.
The changes were requested to be made by Pfizer prior to the next product information update.
Some of those requested changes were as follows –
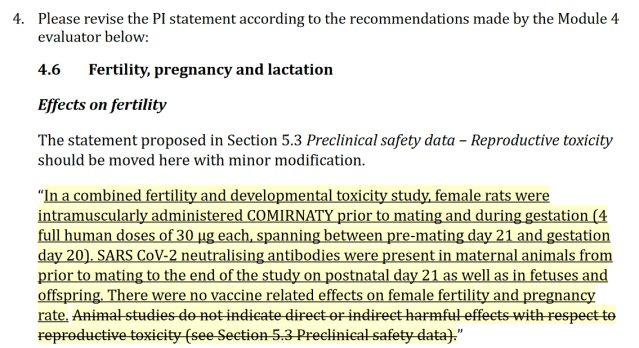
The Module 4 evaluator requested Pfizer remove their claim that “Animal studies do not indicate direct or indirect harmful effects with respect to reproductive toxicity”.
Why?
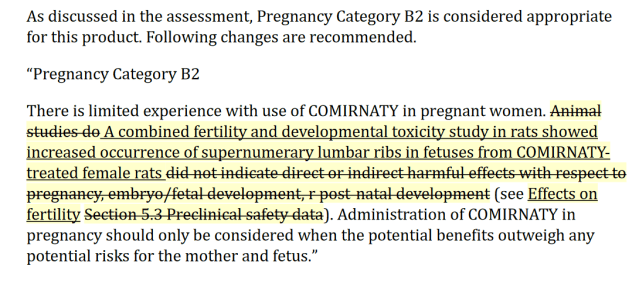
The Module 4 evaluator told Pfizer that ‘Pregnancy Category B2’ was considered appropriate and requested that they added the following line –
“A combined fertility and developmental toxicity study in rats showed increased occurrence of supernumerary lumbar ribs in fetuses from COMIRNATY- treated female rats”.
But here’s a reminder of how the official document issued to the general public reads –
The pregnancy category was changed to ‘B1’, no line was included on the increased occurrence of supernumerary lumbar ribs in fetuses, and they instead included the line that was requested to be removed claiming “Animal studies do not indicate direct or indirect harmful effects with respect to pregnancy…”.
Here’s the official description of the pregnancy categories –
That’s quite a big difference between the two categories. But the fact that the Module 4 evaluator even thought Pregnancy Category B2 was appropriate is highly questionable when you consider the results, as we revealed above, of the “inadequate” and extremely small animal study that was performed to evaluate the safety of administering the Pfizer Covid-19 injection during pregnancy.
So not only do we have evidence that the Pfizer vaccine may cause between 82% and 97% of recipients to lose their babies, we also now have evidence that the Pfizer vaccine leads to an increased risk of suffering infertility or birth defects.
Both of these examples alone support the suggestion that Covid-19 vaccination is going to lead to depopulation. But unfortunately, the evidence doesn’t end there.
Confidential Pfizer Documents reveal the Covid-19 Vaccine accumulates in the Ovaries
Another study, which can be found in the long list of confidential Pfizer documents that the FDA have been forced to publish via a court order here, was carried out on Wistar Han rats, 21 of which were female and 21 of which were male.
Each rat received a single intramuscular dose of the Pfizer Covid-19 injection and then the content and concentration of total radioactivity in blood, plasma and tissues were determined at pre-defined points following administration.
In other words, the scientists conducting the study measured how much of the Covid-19 injection has spread to other parts of the body such as the skin, liver, spleen, heart etc.
But one of the most concerning findings from the study is the fact that the Pfizer injection accumulates in the ovaries over time.
An ‘ovary’ is one of a pair of female glands in which the eggs form and the female hormones oestrogen and progesterone are made.
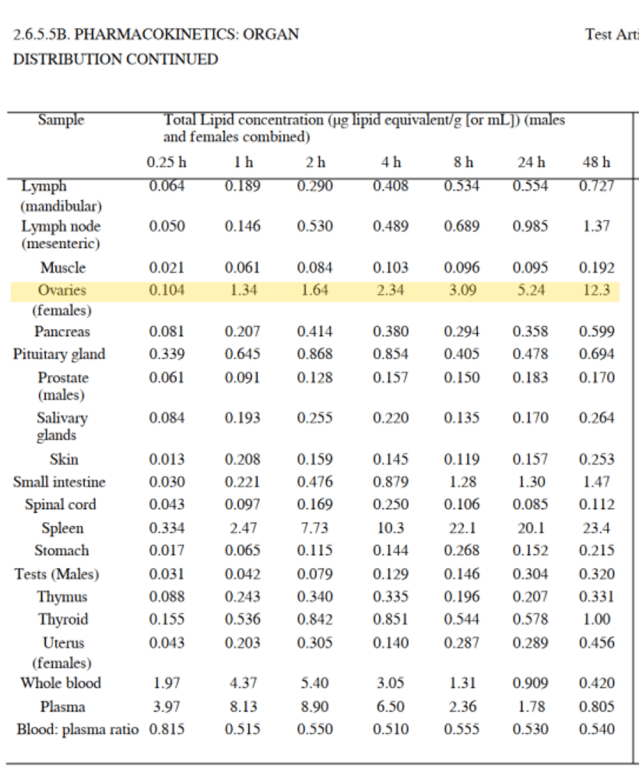
In the first 15 minutes following injection of the Pfizer jab, researchers found that the total lipid concentration in the ovaries measured 0.104ml. This then increased to 1.34ml after 1 hour, 2.34ml after 4 hours, and then 12.3ml after 48 hours.
The scientists, however, did not conduct any further research on the accumulation after a period of 48 hours, so we simply don’t know whether that concerning accumulation continued.
But official UK data published by Public Health Scotland, which can be found here, offers some concerning clues as to the consequences of that accumulation on the ovaries.
Figures for the number of individuals suffering from ovarian cancer show that the known trend in 2021 was significantly higher than in 2020 and the 2017-2019 average.
The above chart shows up to June 2021, but the charts found on Public Health Scotland’s dashboard now show figures all the way up to December 2021 and unfortunately reveal that the gap has widened even further with the number of women suffering Ovarian cancer increasing significantly.
That concludes our third piece of evidence. So now we know –
- Confidential Pfizer documents show a miscarriage rate between 82 and 97%,
- The only animal study performed to prove the safety of administering the Pfizer vaccine during pregnancy indicated an increased risk of infertility and birth defects,
- and further confidential Pfizer documents reveal the vaccine accumulates in the ovaries.
Unfortunately, we also have evidence that Covid-19 vaccination increases the risk of newborn babies sadly losing their lives, and it also comes from the Public Health Scotland ‘Covid-19 Wider Impacts’ dashboard.
Newborn Baby Deaths hit critical levels for 2nd time in 7 Months in March 2022
Official figures reveal that the rate of neonatal deaths increased to 4.6 per 1000 live births in March 2022, a 119% increase on the expected rate of deaths. This means the neonatal mortality rate breached an upper warning threshold known as the ‘control limit’ for the second time in at least four years.
The last time it breached was in September 2021, when neonatal deaths per 1000 live births climbed to 5.1. Although the rate fluctuates from month to month, the figure for both September 2021 and March 2022 is on par with levels that were last typically seen in the late 1980s.
Public Health Scotland (PHS) did not formally announce they had launched an investigation, but this is what they are supposed to do when the upper warning threshold is reached, and they did so back in 2021.
At the time, PHS said the fact that the upper control limit has been exceeded “indicates there is a higher likelihood that there are factors beyond random variation that may have contributed to the number of deaths that occurred”.
Our final piece of evidence to support the claim that Covid-19 vaccination is going to lead to depopulation comes in the form of more real-world data, but this time from the USA.
Covid-19 Vaccination increases risk of suffering Miscarriage by at least 1,517%
According to the Centers for Disease Control’s (CDC)) Vaccine Adverse Event Database (VAERS), as of April 2022, a total of 4,113 foetal deaths had been reported as adverse reactions to the Covid-19 injections, 3,209 of which were reported against the Pfizer injection.
The CDC has admitted that just 1 to 10% of adverse reactions are actually reported to VAERS therefore the true figure could be many times worse. But to put these numbers into perspective, there were only 2,239 reported foetal deaths to VAERS in the 30 years prior to the emergency use authorisation of the Covid-19 injections in December of 2020. (Source)
And a further study which can be viewed here, found that the risk of suffering a miscarriage following Covid-19 vaccination is 1,517% higher than the risk of suffering a miscarriage following flu vaccination.
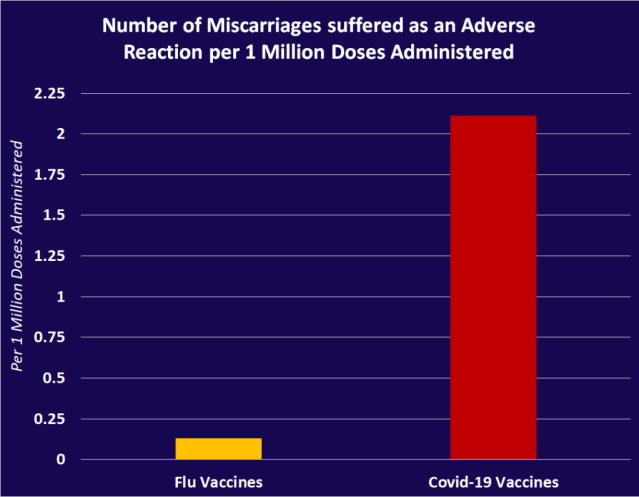
The true risk could however actually be much higher because pregnant women are a target group for Flu vaccination, whereas they are only a small demographic in terms of Covid-19 vaccination so far.
Excess Deaths
Some countries have been quite transparent in publishing data on deaths, such as the UK and Europe for example. However, they have refused to actively publicise the figures because of what they reveal.
But other countries, such as the USA, have done their utmost to conceal data on deaths as much as possible.
However, we have finally managed to find the data for 15% of the world’s countries hidden deep within the website of an organisation known as the Organisation for Economic Co-Operation and Development (OECD).
The OECD is an intergovernmental organisation with 38 member countries founded in 1961 to stimulate economic progress and world trade. And for some reason, they host a wealth of data on excess deaths. You can find that data for yourself here.
The organisation hosts various datasets for countries such as the USA, Canada, New Zealand, Australia, the UK and some of Europe. So we extracted that data to see if deaths have gone down now that a “life-saving” vaccine that is alleged both “safe and effective” has been injected into hundreds of millions of arms worldwide.
However, there is another organisation that provides compiled data for 28 countries across Europe including the UK, known as EuroMOMO, which is a European Mortality Project. So we disregarded the European data found in the OECD dataset and instead extracted the data from the EuroMOMO dataset because it includes more countries and is more up-to-date.
The figures have been provided to both the OECD and EuroMOMO by each country’s Government organisations. The U.S. data has been provided by the Centers for Disease Control. The UK data has been provided by the Office for National Statistics. And Australia’s data has been provided by the Australian Bureau of Statistics.
So these aren’t independent estimates. They are official Government authorised figures.
The following chart reveals what we found in terms of excess deaths across the ‘Five Eyes’; which is an intelligence alliance comprising Australia, Canada, New Zealand, the United Kingdom, and the United States, and a further 27 countries across Europe.
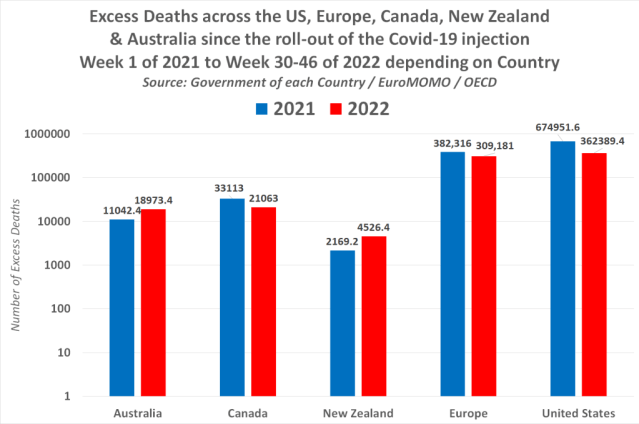
The above chart shows the overall number of excess deaths in each country/continent in 2021 and 2022 so far compared to the 2015-2019 five-year average, and it reveals the U.S. has suffered the most excess deaths in both years with nearly 700k excess deaths in 2021, and just over 360k excess deaths by week 40 of 2022. That is a lot of excess deaths.
Next up we have Europe which suffered 382k excess deaths in 2021 across 28 countries, and 309k excess deaths by week 46 of 2022. Please note the figures for Europe do not include Ukraine so the deaths can not be attributed to the ongoing war.
For reference, the figures for New Zealand cover up to week 40 in 2022, while the figures for Australia cover up to week 30 and the figures for Canada only cover up to week 28. So these aren’t revealing the entire state of affairs so far in 2022.
You may be thinking that this is just a consequence of the Covid-19 pandemic and that although deaths may be high, they have fallen from the numbers recorded prior to the roll-out of the Covid-19 injections.
Unfortunately, this isn’t the case.
The following chart reveals the overall excess deaths in Australia in 2020, 2021 and up to week 30 of 2022 –
The official figures reveal that Australia actually only recorded 1,303 excess deaths in 2020 whilst the world was allegedly in the midst of a “deadly” pandemic.
Unfortunately, this then increased by 747% to 11,042 deaths in 2021 following the roll-out of a Covid-19 injection that was supposed to reduce excess deaths being recorded around the world due to the alleged Covid-19 virus.
But by the end of July 2022, Australia had suffered more excess deaths in 7 months than it had in the previous two years combined, with 18,973 excess deaths, representing a 1,356% increase on 2020.
It’s a similar story in the USA –
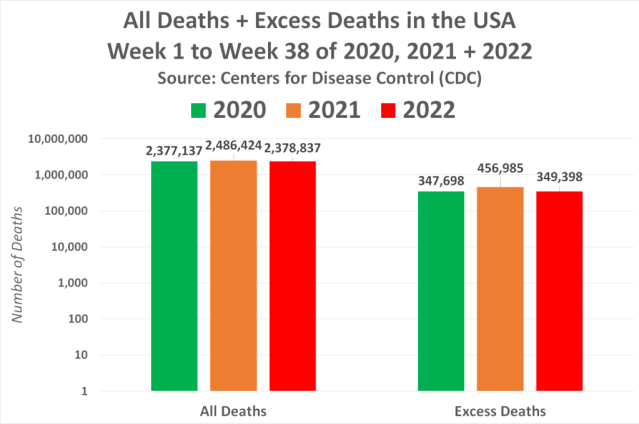
1,700 more Americans actually died by week 38 of 2022 than those who died by week 38 of 2020, despite the fact, there was a huge wave of alleged Covid-19 deaths during this period. While just over 109k more Americans died by week 38 of 2021 than died by week 38 of 2020.
So as you can see, deaths actually increased around the world rather than falling following the mass Covid vaccine roll-out.
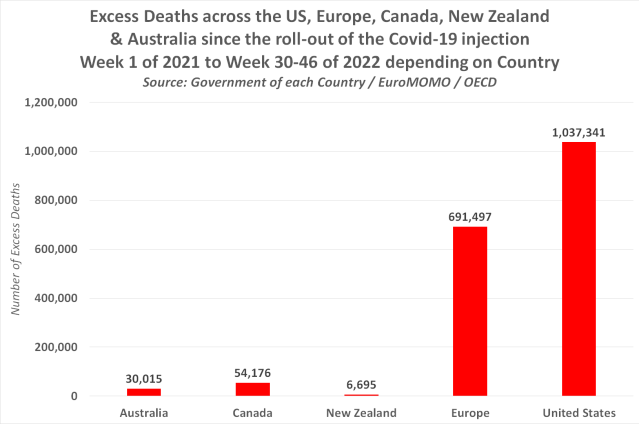
The following chart shows the total excess deaths across the ‘Five Eyes’ and Europe following the roll-out of the Covid-19 injection. However, we have only included the figures from the beginning of 2021, and the Covid-19 injections were actually rolled-out at the beginning of December 2020 –
According to the CDC figures provided to the OECD, there have been over 1 million excess deaths between week 1 of 2021 and week 40 of 2022. While according to official Government figures provided to EuroMOMO by 28 European countries including the UK, France, Germany, Spain and Italy, there have been over 690k excess deaths by week 46 of 2022.
Australia, Canada and New Zealand have all suffered significantly fewer excess deaths but this is only due to the overall population being much smaller. So these are still significant numbers of deaths for each country.
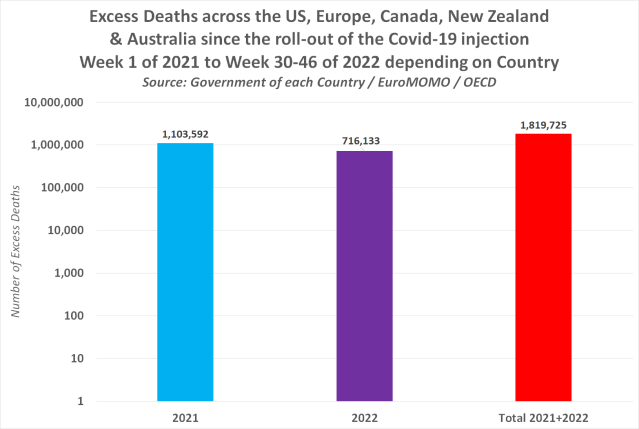
The following chart shows combined excess deaths across the USA, Europe, Canada, New Zealand & Australia in 2021 and 2022 so far, and the combined figures for both years –

In 2021, the ‘Five Eyes’ and most of Europe suffered a shocking 1,103,592 excess deaths. While in 2022, they suffered a shocking 716,133 excess death. But for some of these countries, we only have figures for around the first 7 months.
This means, that ever since the Covid-19 injection was rolled-out, we know for a fact that there have been an astounding 1.8 million excess deaths across the ‘Five Eyes’ and most of Europe.
The official narrative states that deaths in 2020 increased due to an alleged deadly Covid-19 pandemic. The official narrative also states that the Covid-19 injection was safe and effective and would therefore reduce the number of deaths. But we have seen the opposite happen.
Therefore, the official narrative is an outright lie, and official figures published by the UK Government don’t just suggest, but actually prove that the Covid-19 vaccines are the biggest contributing factor to the millions of excess deaths seen across the ‘Five Eyes’ and most of Europe.
Evidence the COVID Injections are killing Millions
The figures can be found in a report titled ‘Deaths by Vaccination Status, England, 1 January 2021 to 31 May 2022‘, and it can be accessed on the ONS site here, and downloaded here.
Table 2 of the report contains the monthly age-standardised mortality rates by vaccination status by age group for deaths per 100,000 person-years in England up to May 2022.
Here’s how the ONS present the data for 18 to 39-year-olds in May 2022 –
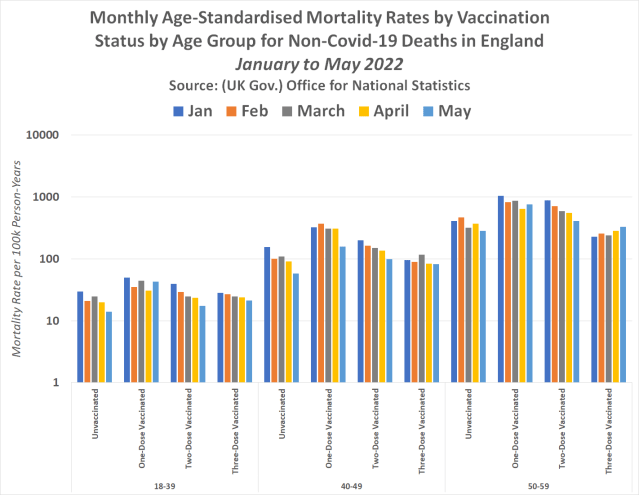
We’ve taken the figures provided by the ONS for January to May 2022 and produced the following charts which reveal the horrific consequences of the mass Covid-19 vaccination campaign.
18 to 39-year-olds
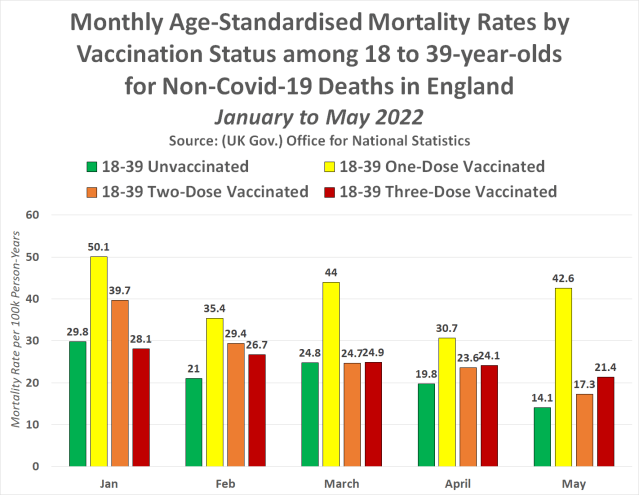
The following chart shows the monthly age-standardised mortality rates by vaccination status among 18 to 39-year-olds for Non-Covid-19 deaths in England between January and May 2022 –
In every single month since the beginning of 2022, partly vaccinated and double vaccinated 18-39-year-olds have been more likely to die than unvaccinated 18 to 39-year-olds. Triple vaccinated 18 to 39-year-olds however have had a mortality rate that has worsened by the month following the mass Booster campaign that occurred in the UK in December 2021.
In January, triple vaccinated 18 to 39-year-olds were ever so slightly less likely to die than unvaccinated 18 to 39-year-olds, with a mortality rate of 29.8 per 100,000 among the unvaccinated and 28.1 per 100,000 among the triple vaccinated.
But this all changed from February onwards. In February, triple vaccinated 18 to 39-year-olds were 27% more likely to die than unvaccinated 18 to 39-year-olds, with a mortality rate of 26.7 per 100k among the triple vaccinated and 21 per 100k among the unvaccinated.
Things have unfortunately got even worse for the triple vaccinated by May 2022 though. The data shows that triple vaccinated 18 to 39-year-olds were 52% more likely to die than unvaccinated 18 to 39-year-olds in May, with a mortality rate of 21.4 per 100k among the triple vaccinated and 14.1 among the unvaccinated.
The worst figures so far though are among the partly vaccinated, with May seeing partly vaccinated 18 to 39-year-olds 202% more likely to die than unvaccinated 18 to 39-year-olds.
40 to 49-year-olds
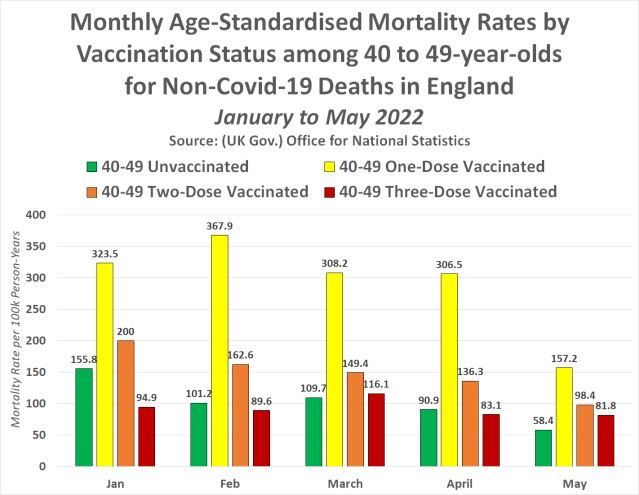
The following chart shows the monthly age-standardised mortality rates by vaccination status among 40 to 49-year-olds for Non-Covid-19 deaths in England between January and May 2022 –
We see pretty much the same when it comes to 40 to 49-year-olds. In every single month since the beginning of 2022, partly vaccinated and double vaccinated 40 to 49-year-olds have been more likely to die than unvaccinated 40 to 49–year-olds.
The worst month for mortality rates among the partly and double vaccinated compared to the unvaccinated was February. This month saw partly vaccinated 40-49-year-olds 264% more likely to die than unvaccinated 40-49-year-olds. Whilst double vaccinated 40-49-year-olds were 61% more likely to die than unvaccinated 40-49-year-olds.
By May 2022, five months after the mass Booster campaign, triple vaccinated 40-49-year-olds were 40% more likely to die than unvaccinated 40-49-year-olds, with a mortality rate of 81.8 per 100k among the triple vaccinated and a mortality rate of 58.4 among the unvaccinated.
50 to 59-year-olds
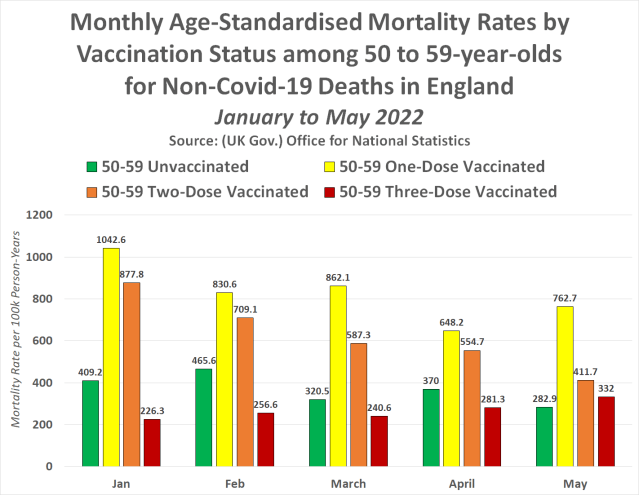
The following chart shows the monthly age-standardised mortality rates by vaccination status among 50 to 59-year-olds for Non-Covid-19 deaths in England between January and May 2022 –
Yet again we see exactly the same pattern among 50 to 59-year-olds as seen among 40-49-year-olds.
In every single month since the beginning of 2022, partly vaccinated and double vaccinated 50 to 59-year-olds have been more likely to die than unvaccinated 50-59–year-olds.
May was the worst month for partly vaccinated 50 to 59-year-olds, as they were 170% more likely to die than unvaccinated 50 to 59-year-olds.
Whereas January was the worst month for double vaccinated 50-59-year-olds, as they were 115% more likely to die than unvaccinated 50-59-year-olds.
By May 2022, five months after the mass Booster campaign, triple vaccinated 50-59-year-olds were 17% more likely to die than unvaccinated 50-59-year-olds, with a mortality rate of 332 per 100k among the triple vaccinated and a mortality rate of 282.9 per 100k among the unvaccinated.
Therefore, by May 2022, unvaccinated 50-59-year-olds were the least likely to die among all vaccination groups.
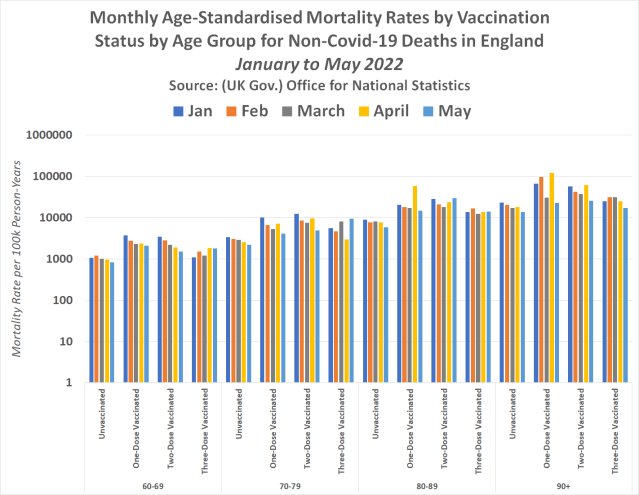
60 to 69-year-olds
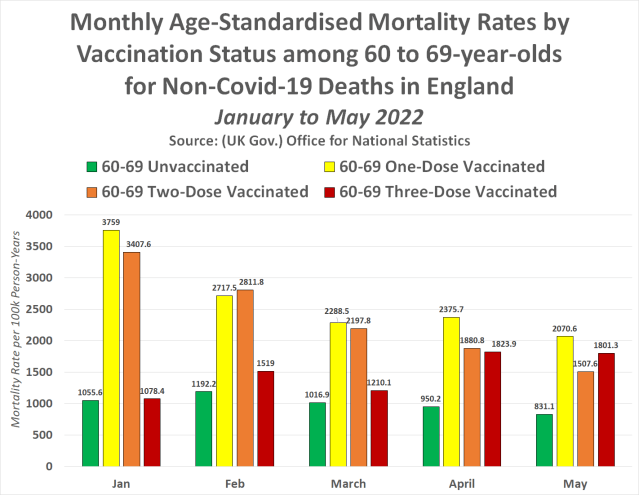
The following chart shows the monthly age-standardised mortality rates by vaccination status among 60 to 69-year-olds for Non-Covid-19 deaths in England between January and May 2022 –
The 60 to 69-year-olds show exactly the same pattern as 18 to 39-year-olds. The double and partly vaccinated have been more likely to die than the unvaccinated since the turn of the year, and the triple vaccinated have been more likely to die than the unvaccinated since February.
In January, partly vaccinated 60-69-year-olds were a shocking 256% more likely to die than unvaccinated 60-69-year-olds. Whilst in the same month, double vaccinated 60-69-year-olds were 223% more likely to die than unvaccinated 60-69-year-olds.
By May, triple vaccinated 60-69-year-olds were a troubling 117% more likely to die than unvaccinated 60-69-year-olds, with a mortality rate of 1801.3 per 100k among the triple vaccinated and a mortality rate of just 831.1 among the unvaccinated.
70 to 79–year-olds
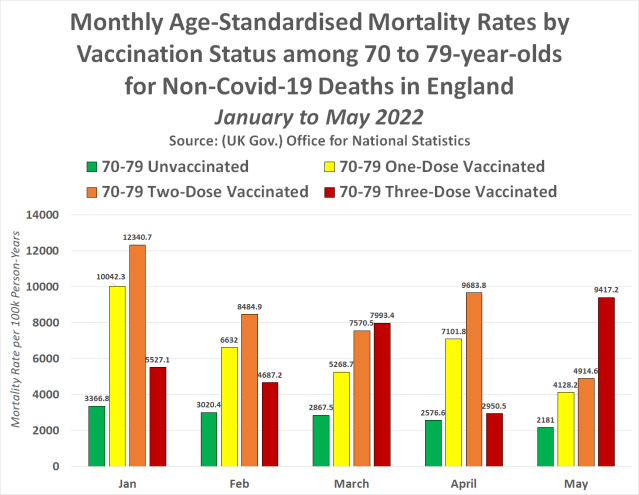
The following chart shows the monthly age-standardised mortality rates by vaccination status among 70 to 79-year-olds for Non-Covid-19 deaths in England between January and May 2022 –
Things are slightly different for 70 to 70-year-olds because the data reveals the unvaccinated have been the least likely to die every month since the turn of the year.
In January, the partly vaccinated were 198% more likely to die than the unvaccinated, whilst the double vaccinated were a shocking 267% more likely to die than the unvaccinated.
The worst figures however come in May, which saw triple vaccinated 70-79-year-olds a disturbing 332% more likely to die than unvaccinated 70-79-year-olds, with a mortality rate of 9417.2 per 100k among the triple vaccinated and just 2181 per 100k among the unvaccinated.
80 to 89-year-olds
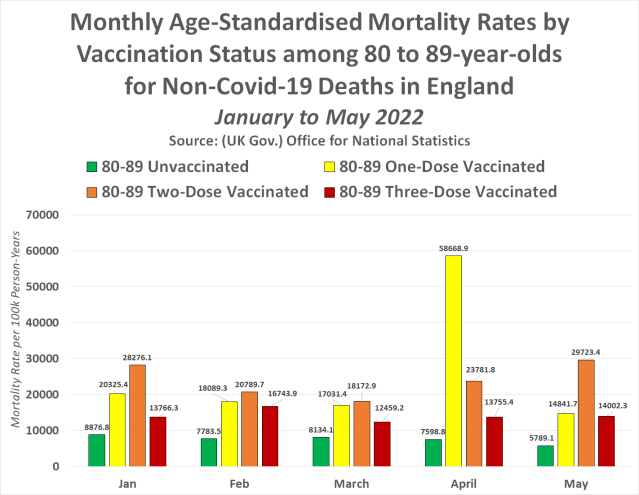
The following chart shows the monthly age-standardised mortality rates by vaccination status among 80 to 89-year-olds for Non-Covid-19 deaths in England between January and May 2022 –
Again we see the same pattern among 80-89-year-olds as seen among 70-79-year-olds, with the unvaccinated the least likely to die every month since the turn of the year.
In April, double vaccinated 80-89-year-olds were 213% more likely to die than unvaccinated 80-89-year-olds, with a mortality rate of 7598.9 per 100k among the unvaccinated and a mortality rate of a troubling 23,781.8 per 100k among the double vaccinated.
But in the same month, partly vaccinated 80-89-year-olds were a terrifying 672% more likely to die than unvaccinated 80-89-year-olds, with a shocking mortality rate of 58,668.9 per 100k among the partly vaccinated.
By May 2022, triple vaccinated 80-89-year-olds were 142% more likely to die than unvaccinated 80-89-year-olds, with a mortality rate of 14,002.3 among the triple vaccinated and a mortality rate of 5,789.1 among the unvaccinated.
90 + year-olds
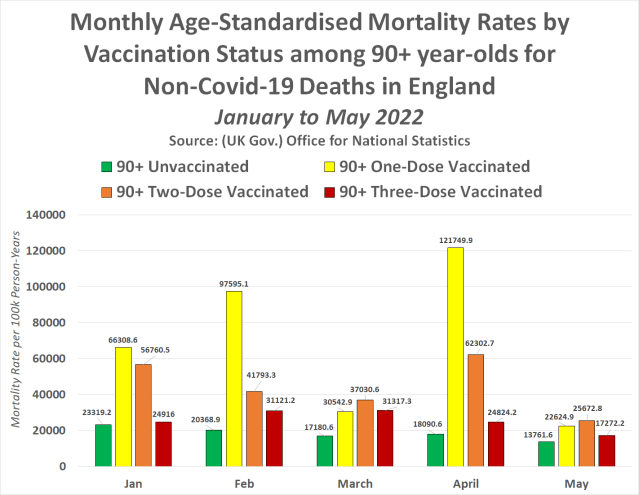
The following chart shows the monthly age-standardised mortality rates by vaccination status among 90+ year-olds for Non-Covid-19 deaths in England between January and May 2022 –
Finally, we again see the same pattern among 90+ year-olds, with the unvaccinated the least likely to die every month since the turn of the year.
In April, double vaccinated 90+ year-olds were 244% more likely to die than unvaccinated 90+ year-olds, with a mortality rate of 62,302.7 per 100k among the double vaccinated and a mortality rate of 18,090.6 among the unvaccinated.
During the same month, however, partly vaccinated 90+ year-olds were a shocking 572% more likely to die than unvaccinated 90+ year-olds, with a mortality rate of 121,749.9 per 100k person-years among the partly vaccinated.
By May 2022, triple vaccinated 90+ year-olds were 26% more likely to die than unvaccinated 90+ year-olds, with a mortality rate of 13,761.6 per 100k among the unvaccinated and a mortality rate of 17,272.2 per 100k among the triple vaccinated.
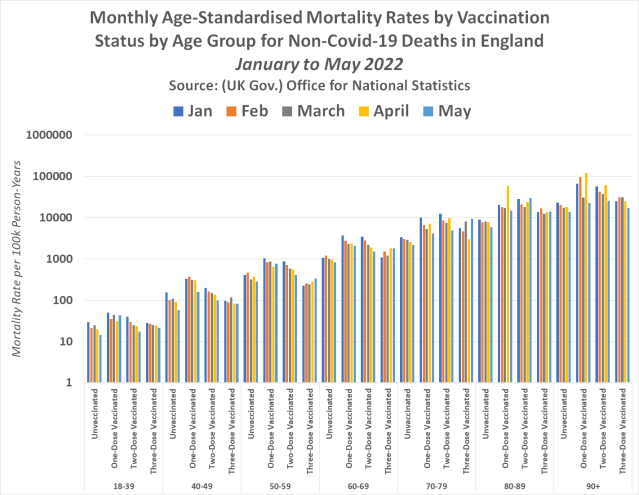
The following three charts show the monthly age-standardised mortality rates by vaccination status for non-Covid-19 deaths in England between January and May 2022 as detailed above but collated together for all age groups –
Due to the above figures being age-standardised and rates per 100,000 population, they are indisputable evidence that the Covid-19 injections increase the risk of death and are killing people.
So with –
- Confidential Pfizer documents showing a miscarriage rate between 82% and 97%,
- The only animal study performed to prove the safety of administering the Pfizer vaccine during pregnancy indicating an increased risk of infertility and birth defects,
- Further confidential Pfizer documents revealing the vaccine accumulates in the ovaries, data from Scotland revealing cases of Ovarian cancer are at an all time high,
- Further data from Scotland revealing deaths of new born babies have hit critical levels for the second time in seven months,
- CDC VAERS data showing Covid-19 vaccination increases the risk of suffering a miscarriage by at least 1,517%,
- Official Government data proving the U.S., U.K., Australia, New Zealand, Canada & Europe have suffered 1.8 million excess deaths since the Covid-19 vaccine roll-out;
- And official UK Government data proving mortality rates per 100,000 are lowest among the unvaccinated in every single age group;
It looks like we have more than enough evidence to prove that Covid-19 vaccination is causing mass depopulation and that your Government is trying to kill you.


