The UK government’s covid interventions were followed by spikes in mortality

The UK government implemented various lockdowns and restrictions in response to the covid “pandemic.” To visualise these responses, the Institute for Government – which “helps those working in government to improve it, and those outside government to understand and engage with it” – published an infographic in December 2022.
“I was hoping to see their follow-up, showing what a splendid job they had done in terms of actual mortality reduction,” Joel Smalley writes.
However, it appears this is not the case. So, Smalley did his own.
Here is how the Government’s covid policy affected native men and women of England and Wales.
Let’s not lose touch…Your Government and Big Tech are actively trying to censor the information reported by The Exposé to serve their own needs. Subscribe now to make sure you receive the latest uncensored news in your inbox…
By Joel Smalley
The Institute for Government (whoever the hell they are) have conveniently summarised the UK Government’s most impressive covid interventions on a nice infographic for us:
Given that these measures were ultimately supposed to reduce the number of UK citizens dying from the deadly virus, I was hoping to see their follow-up, showing what a splendid job they had done in terms of actual mortality reduction.
Alas, I could not find one, so had to do my own.
Here’s how Government policy affected native men and women of England & Wales, born in 1950 (70 years old at the start of the alleged pandemic).
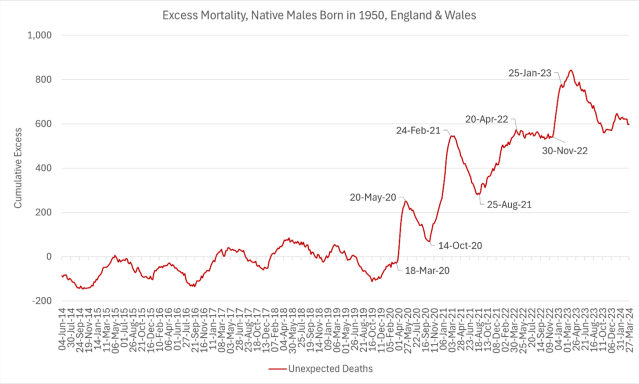
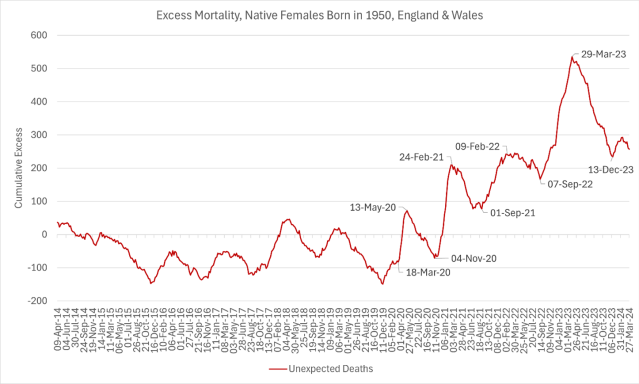
23 March 2020
PM announces the first lockdown in the UK, ordering people to “stay at home.” Of course, this was not simply a withdrawal of basic freedoms for ordinary people but the start of a cascade of other severe disruptions to social and medical care, signalling the precipitous, sudden rise of deaths in both men and women.
10 May 2020
PM announces a conditional plan for lifting lockdown and says that people who cannot work from home should return to the workplace but avoid public transport. As life starts to return to normal, deaths of both men and women immediately start to fall. Go figure!
14 October 2020
A new three-tier system of covid-19 restrictions starts in England. Immediately, deaths of men skyrockets just like in the spring.
5 November 2020
Second national lockdown comes into force in England to prevent a “medical and moral disaster” for the NHS. Immediately, deaths of women skyrockets just like in the spring.
6 January 2021
England enters third national lockdown (after various nonsensical regional variations and curfews). Deaths of both men and women continue to rise at the same precipitous rate, without any interruption, for the entire duration of the interventions.
22 February 2021
PM expected to publish roadmap for lifting the lockdown (which starts first week of March). Within days, deaths of both men and women begin to fall again.
September 2021
According to NHS data, as of September 2021, over 90% of care home residents and over 80% of care home staff had received at least one dose of the covid-19 vaccine. Additionally, as of November 2021, over 70% of NHS Trust healthcare workers had received at least one dose of the covid-19 vaccine. Deaths rise for both men and women at least as quickly as normal seasonal patterns in spite of expectations for pull-forward effect due to so much excess death in the prior 18 months.
April 2022
The spring booster campaign began on 21 March 2022 in England and ran until the early summer. Instead of deaths falling as they typically do in a seasonal pattern, they remain consistently high for men and only drop marginally for women, in spite of so much prior excess that must surely be producing a pull-forward effect by now?
September 2022
NHS England confirms deployment of a single type of vaccine, the bivalent Omicron BA.1/Original “wild-type” vaccines. Deaths of women shoot up more rapidly than at any other time during the “pandemic years,” for a full, relentless six months. In spite of expectations of very long overdue pull-forward effect, deaths of men rise at the same pace and magnitude as the original spike in spring 2020.
So many Government agencies, so many interventions, so many coincidences. And every one of them coinciding with spikes in mortality when introduced and drops in mortality when lifted.
Imagine how bad it would have been without them?! It’s enough to turn you into a conspiracy theorist …
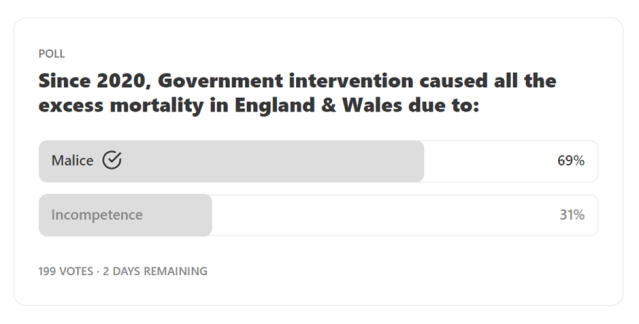
[Click on the image below which will take you to Joel Smalley’s article where you can participate in the poll.]
Appendix: The Mortality Model
About the Author
Joel Smalley is a blockchain architect and an early-stage, polymath data-driven technologist. He has a background in capital markets, biotechnology, retail payments and blockchain architecture. He conducts pro bono covid data analysis for legal challenges and independent media seeking the truth. He regularly publishes articles on his Substack ‘Dead Man Talking’ which you can subscribe to HERE.
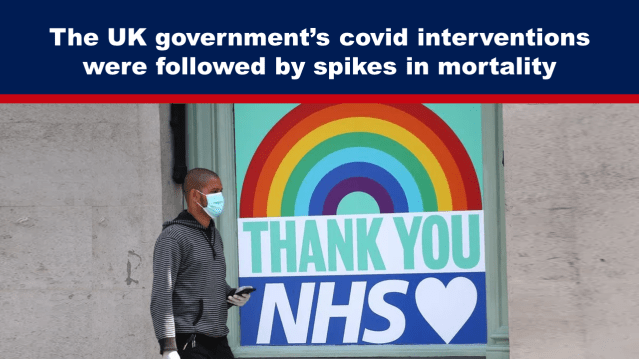
Featured image taken from ‘Covid: UK’s early response worst public health failure ever, MPs say’, BBC, 12 October 2021